THURSDAY, JUL 22, 2021
We redesigned the TractIQ dashboard to improve your overall user experience. Whether you’re a first-time user or a loyal, longtime patron, check out our new dashboard to see how we’ve simplified finding data insights. In just a few clicks, find the insights you need for any tract of land across the United States to help drive data-based business decisions.
Our new dashboard offers tailored experiences for our users. We’ve made it easier for everyone to glean the demographic data insights they need through our sleek and straightforward design and functionality. Let’s show you around!
When you log into your TractIQ account, you will be greeted with the new area analysis shortcut. This allows you to quickly and easily choose from radius, drive, walk, or cycle times for any area of land in the U.S. straight from the dashboard.
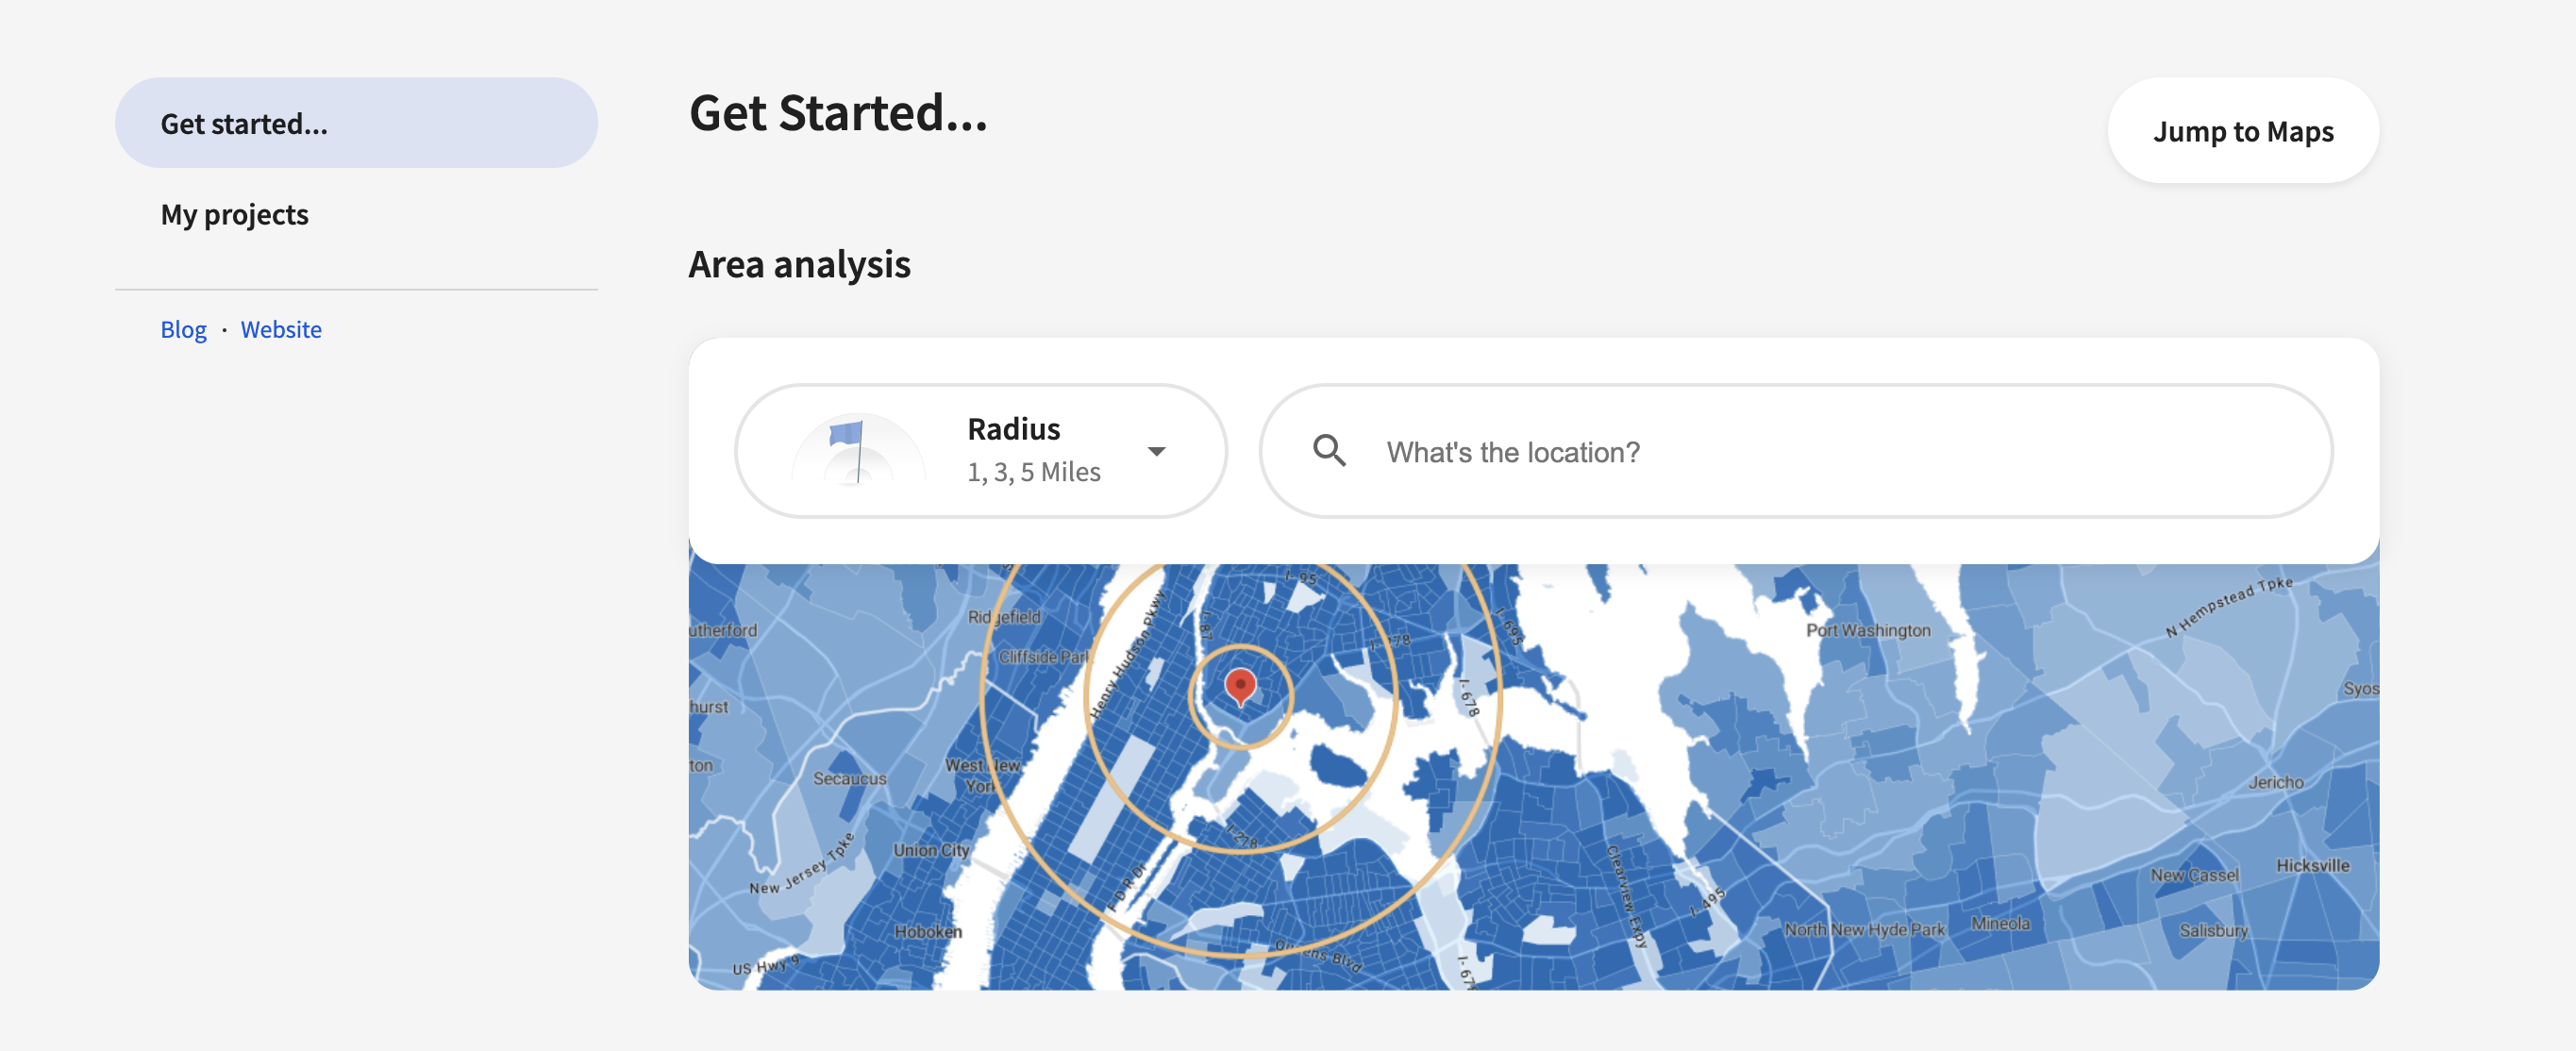
Start your area analysis straight from the new TractIQ dashboard
We’ve also created shortcuts to some of our key features, such as Change over Time and Filter Areas by Criteria. Our change over time shortcuts allow you to be instantly redirected to map views showing key growth projections, such as population, employment, or median household income, and our filter by criteria shortcut allows you to quickly create profiles and locate areas on the map that match your specified criteria.
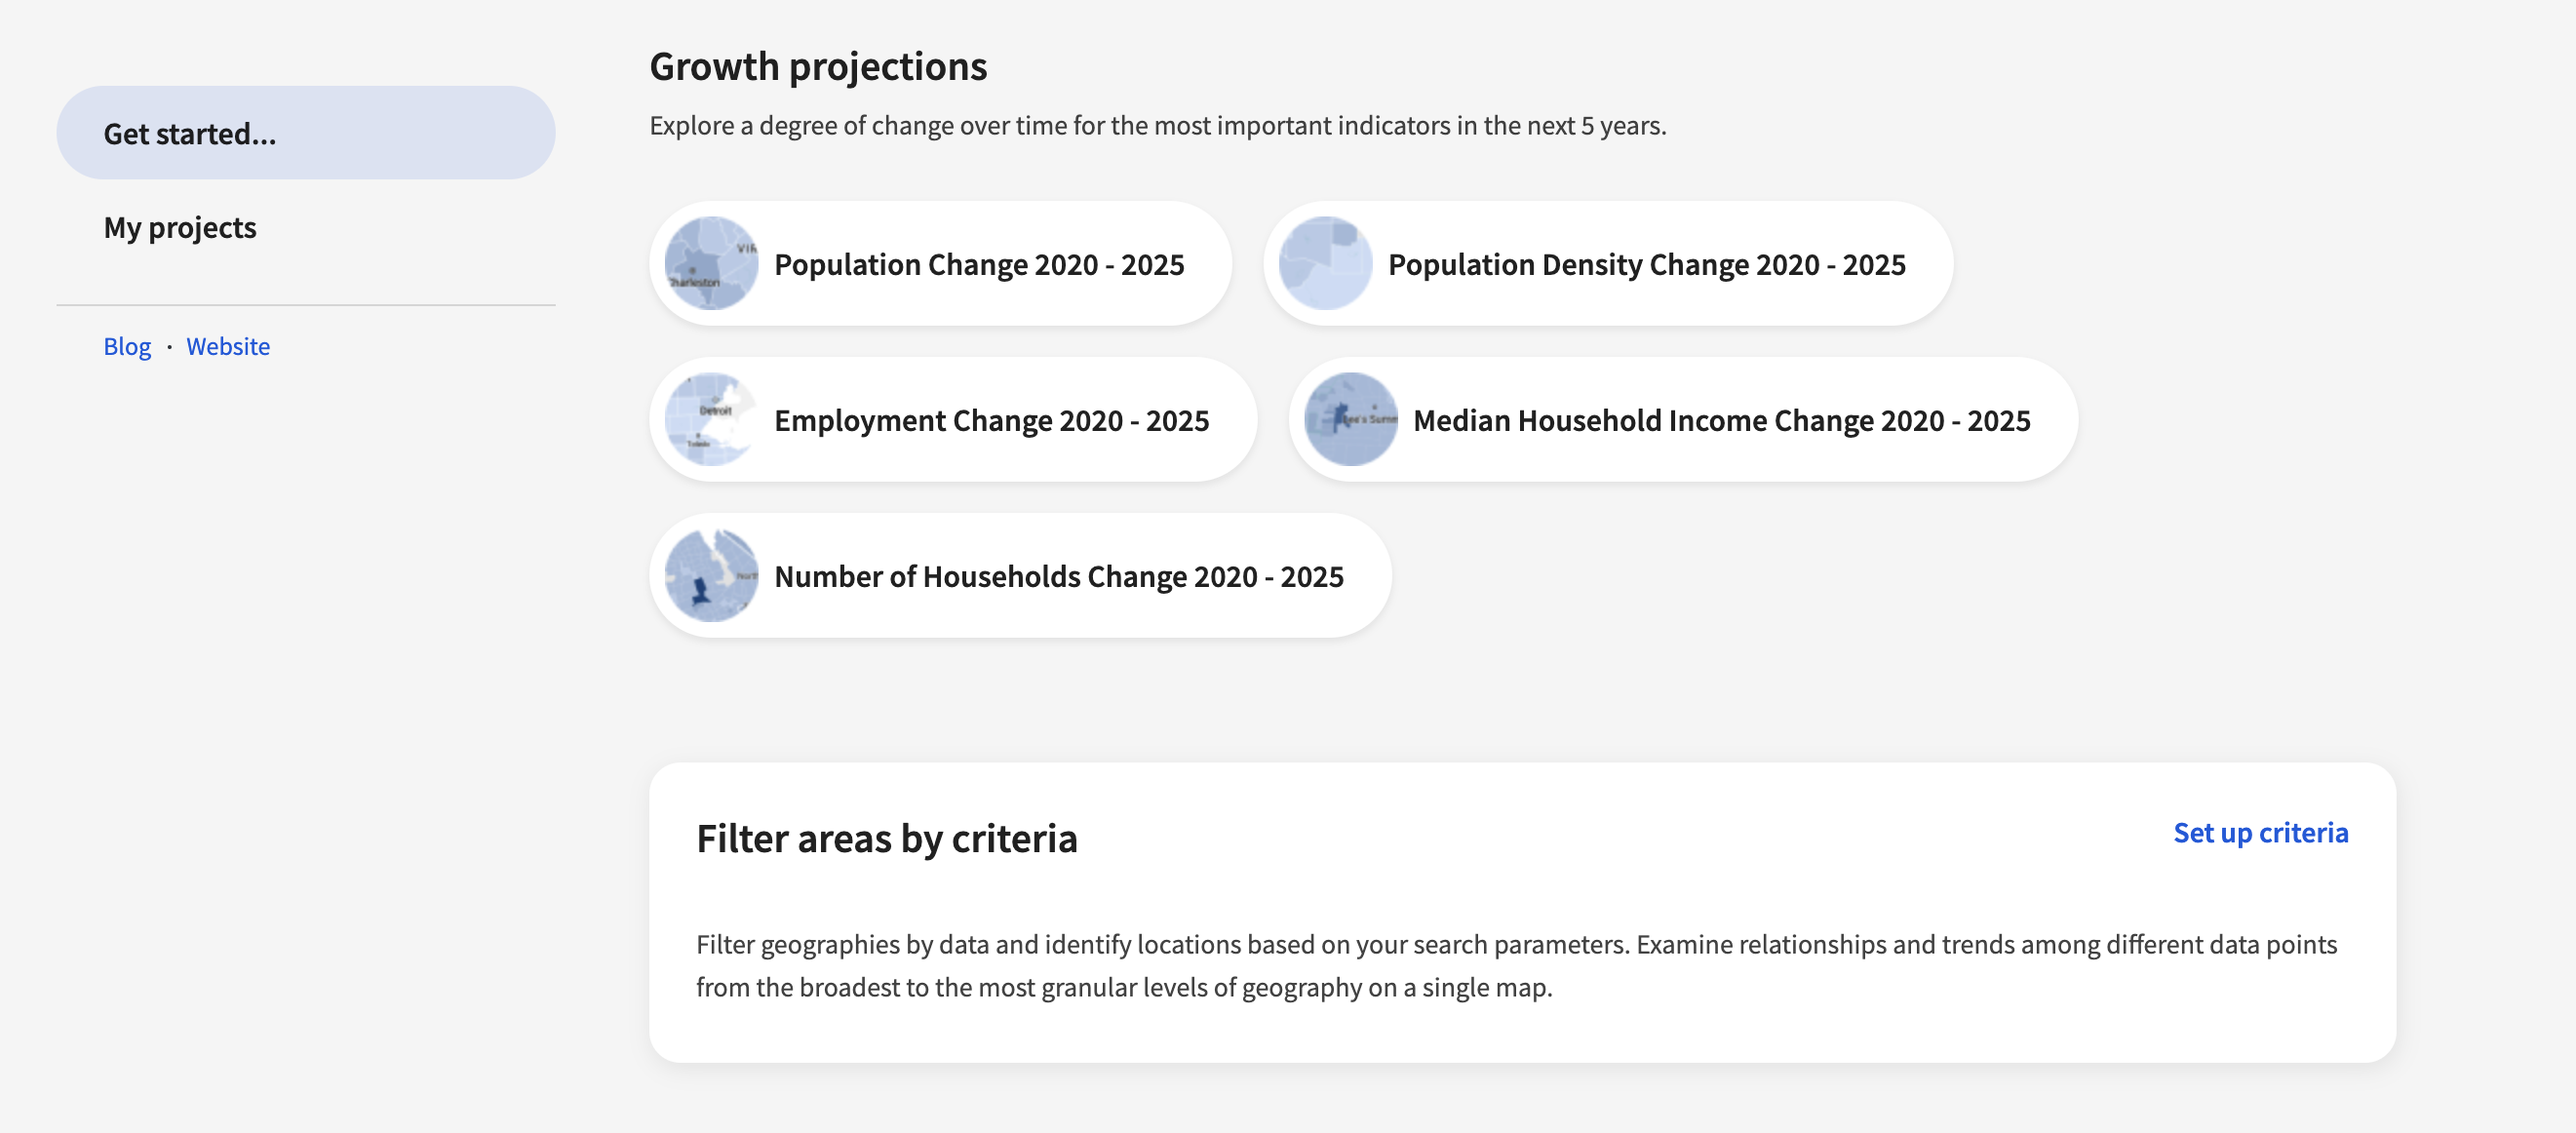
See growth projection maps and set up filter criteria directly from the dashboard
You can also create new reports and report templates directly from the dashboard. All of your templates will be shown in the create report section, allowing you to access your templates quickly and simplifying the process of creating new reports.
We’ve also sorted through hundreds of thousands of data indicators and pinpointed the most popular variables to help aid in the data search process. With our key indicators section, you can immediately be redirected to map views showing some of the most critical demographic insights for real estate and other relevant markets. This shortcut gives you a direct link to critical demographic data, and with just one click, you will be redirected to maps depicting important data insights.

Create reports directly from the dashboard or redirect to maps depicting key indicators
If you want to explore our maps and capabilities freely without taking any shortcuts, don’t fret. Simply click on the Jump to Maps button on the top right-hand corner of the dashboard or Explore Maps at the bottom of the page to be redirected to our mapping feature.
Try out our new TractIQ dashboard and tell us what you think. Use the Feedback option at the top of the map to send us your feedback, suggestions, comments, and questions or email us your thoughts. We would love to know how we can help you do more with our platform.
Author: Hana Trokic