THURSDAY, JAN 28, 2021
TractIQ offers valuable data, tools, and insights to help you confidently target and analyze any tract of land in the United States, allowing you to make supported business decisions. Endless data possibilities are just a few clicks away as our platform enables you to explore locations, opportunities, and trends in real estate with complete ease and certainty.
Continually striving to bring innovations to data, we recently added our new radius and drive time reporting feature to TractIQ. This feature allows you to compare demographic and economic data for multiple areas, drive times, radiuses, and years in just a few simple steps.
Location Analysis Made Quick and Easy
Using our new features is quick and easy. To begin, on the TractIQ map, enter your specific location of interest in the search bar which can be found on the top left corner of your screen.
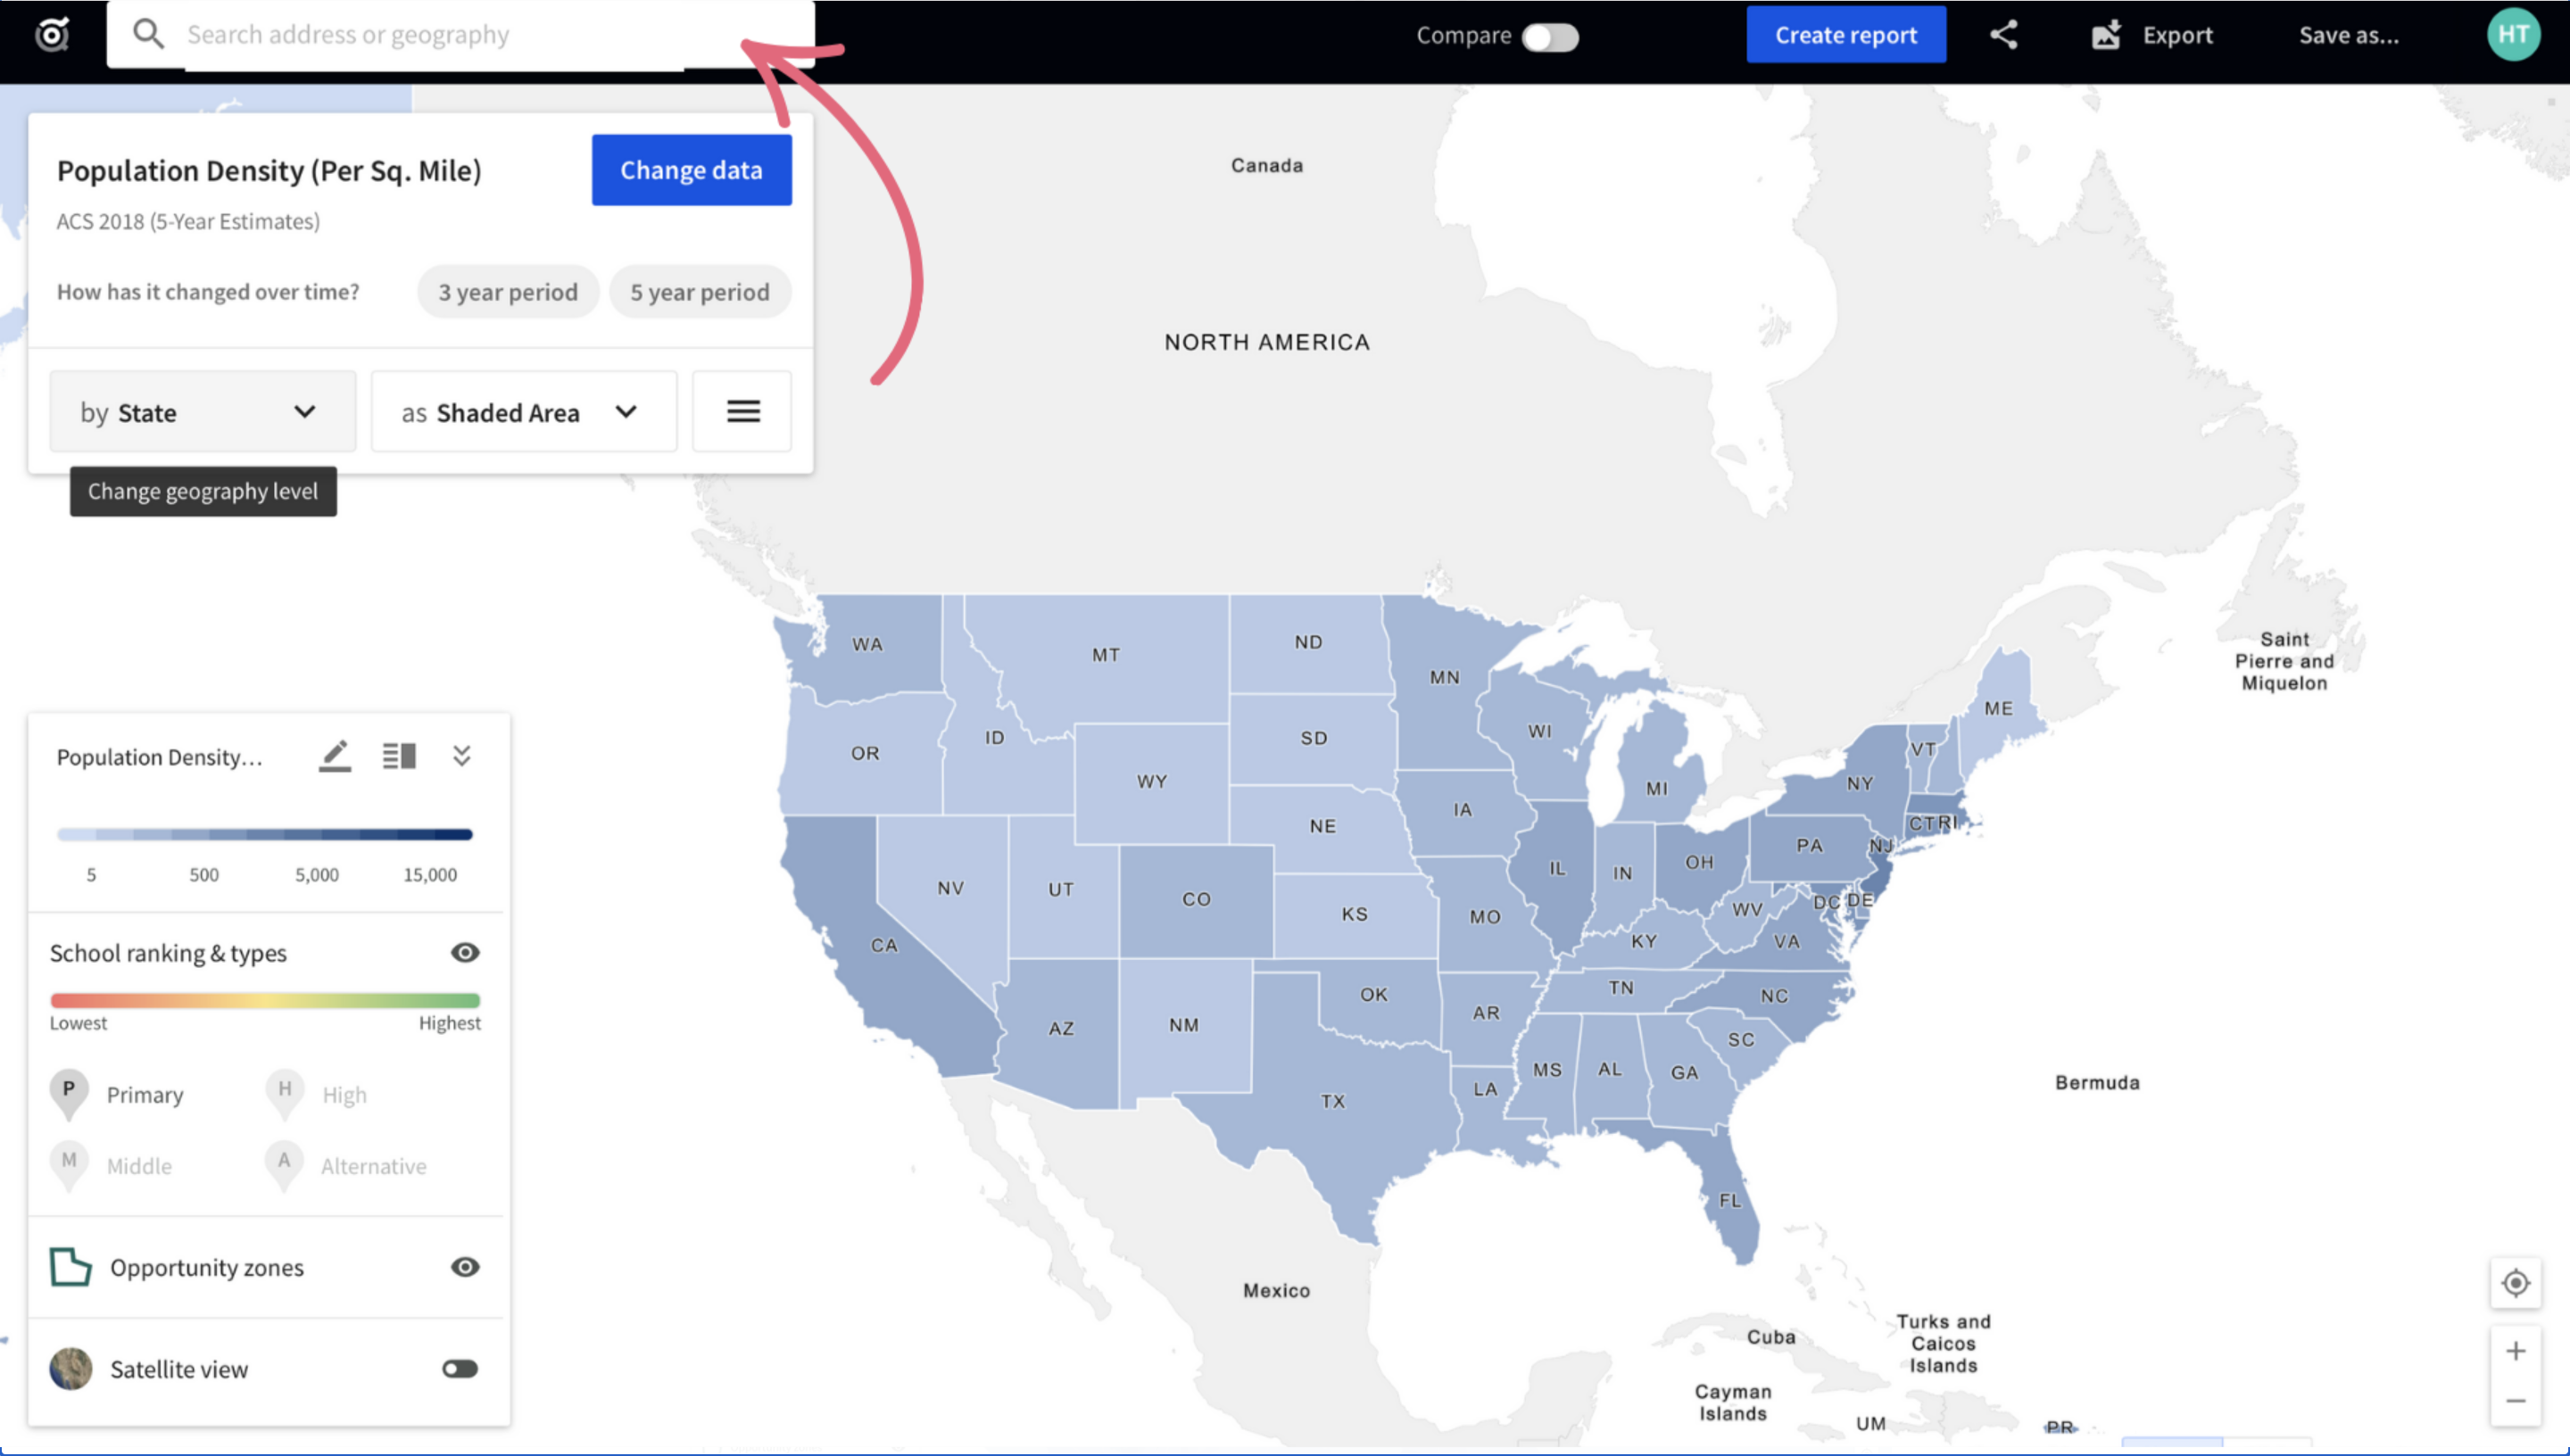
Enter your location of interest in the search bar to explore our new features
Once you have selected your location of interest, you will be able to choose between four available options from radius, drive, walking, and cycling time. Note that you can choose between single and multi ring. Multi ring will allow you to select up to 3 radiuses.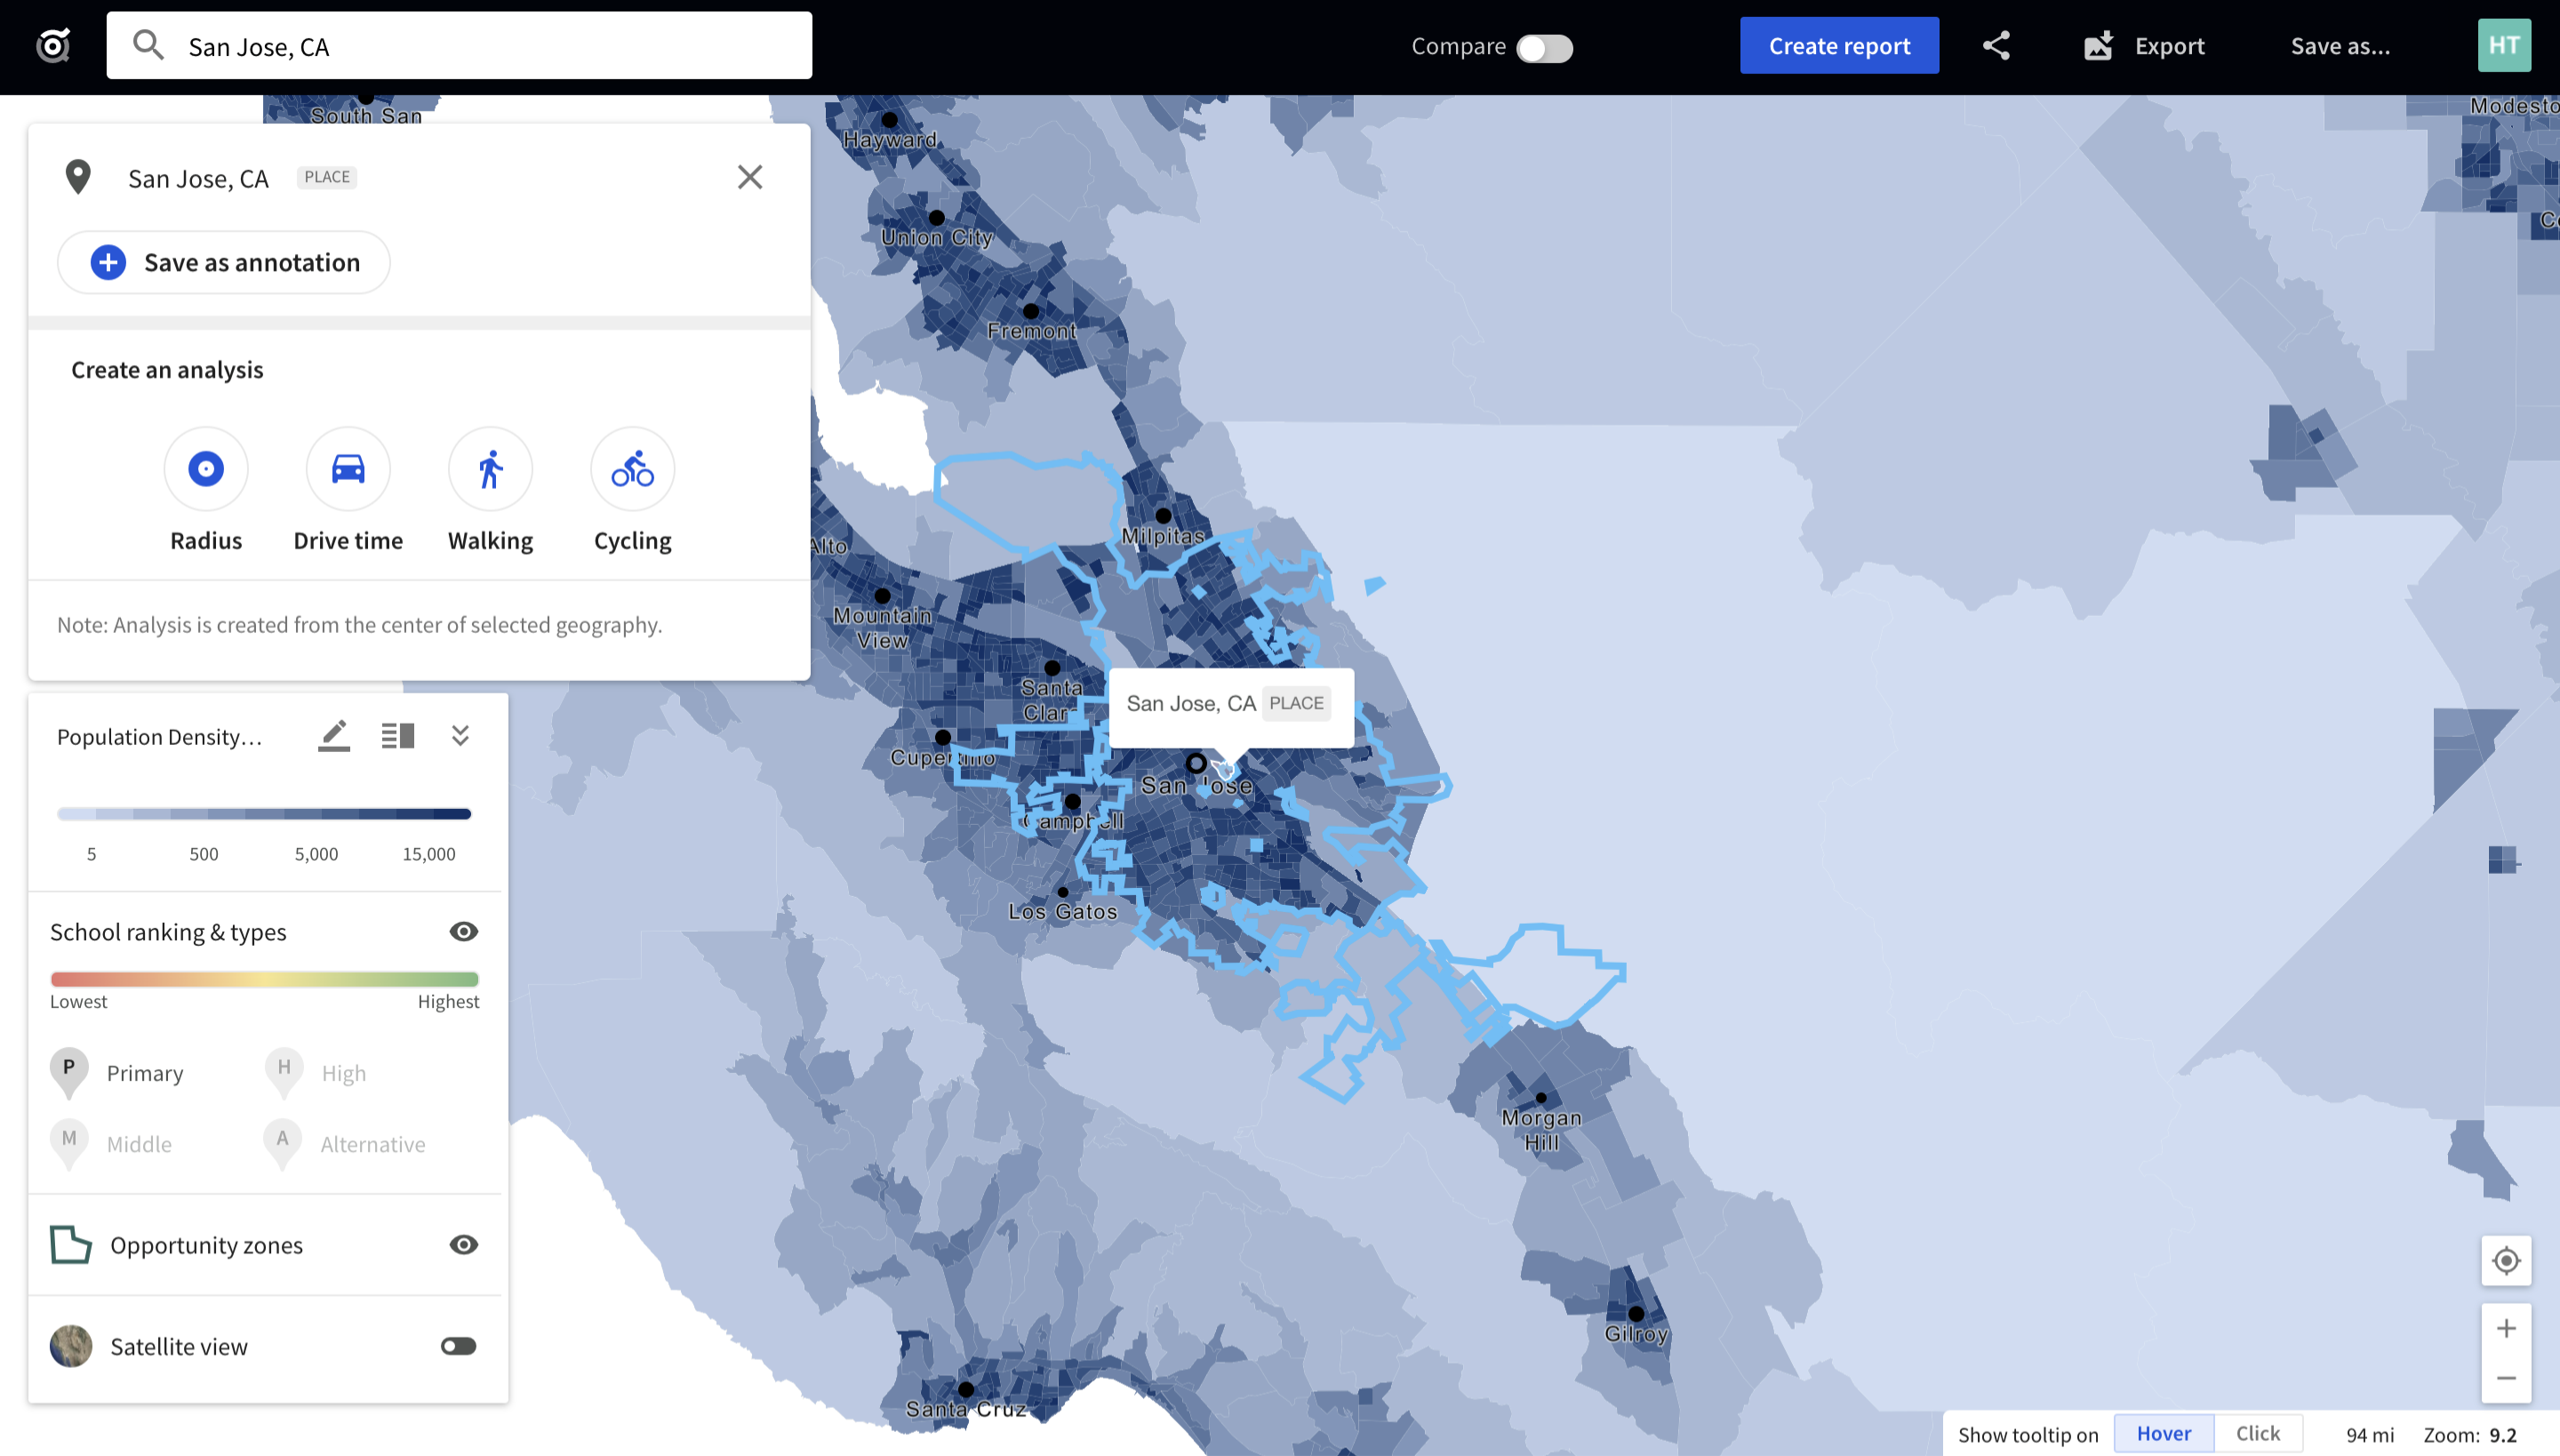
Select from four available analysis options: radius, drive time, walking, and cycling time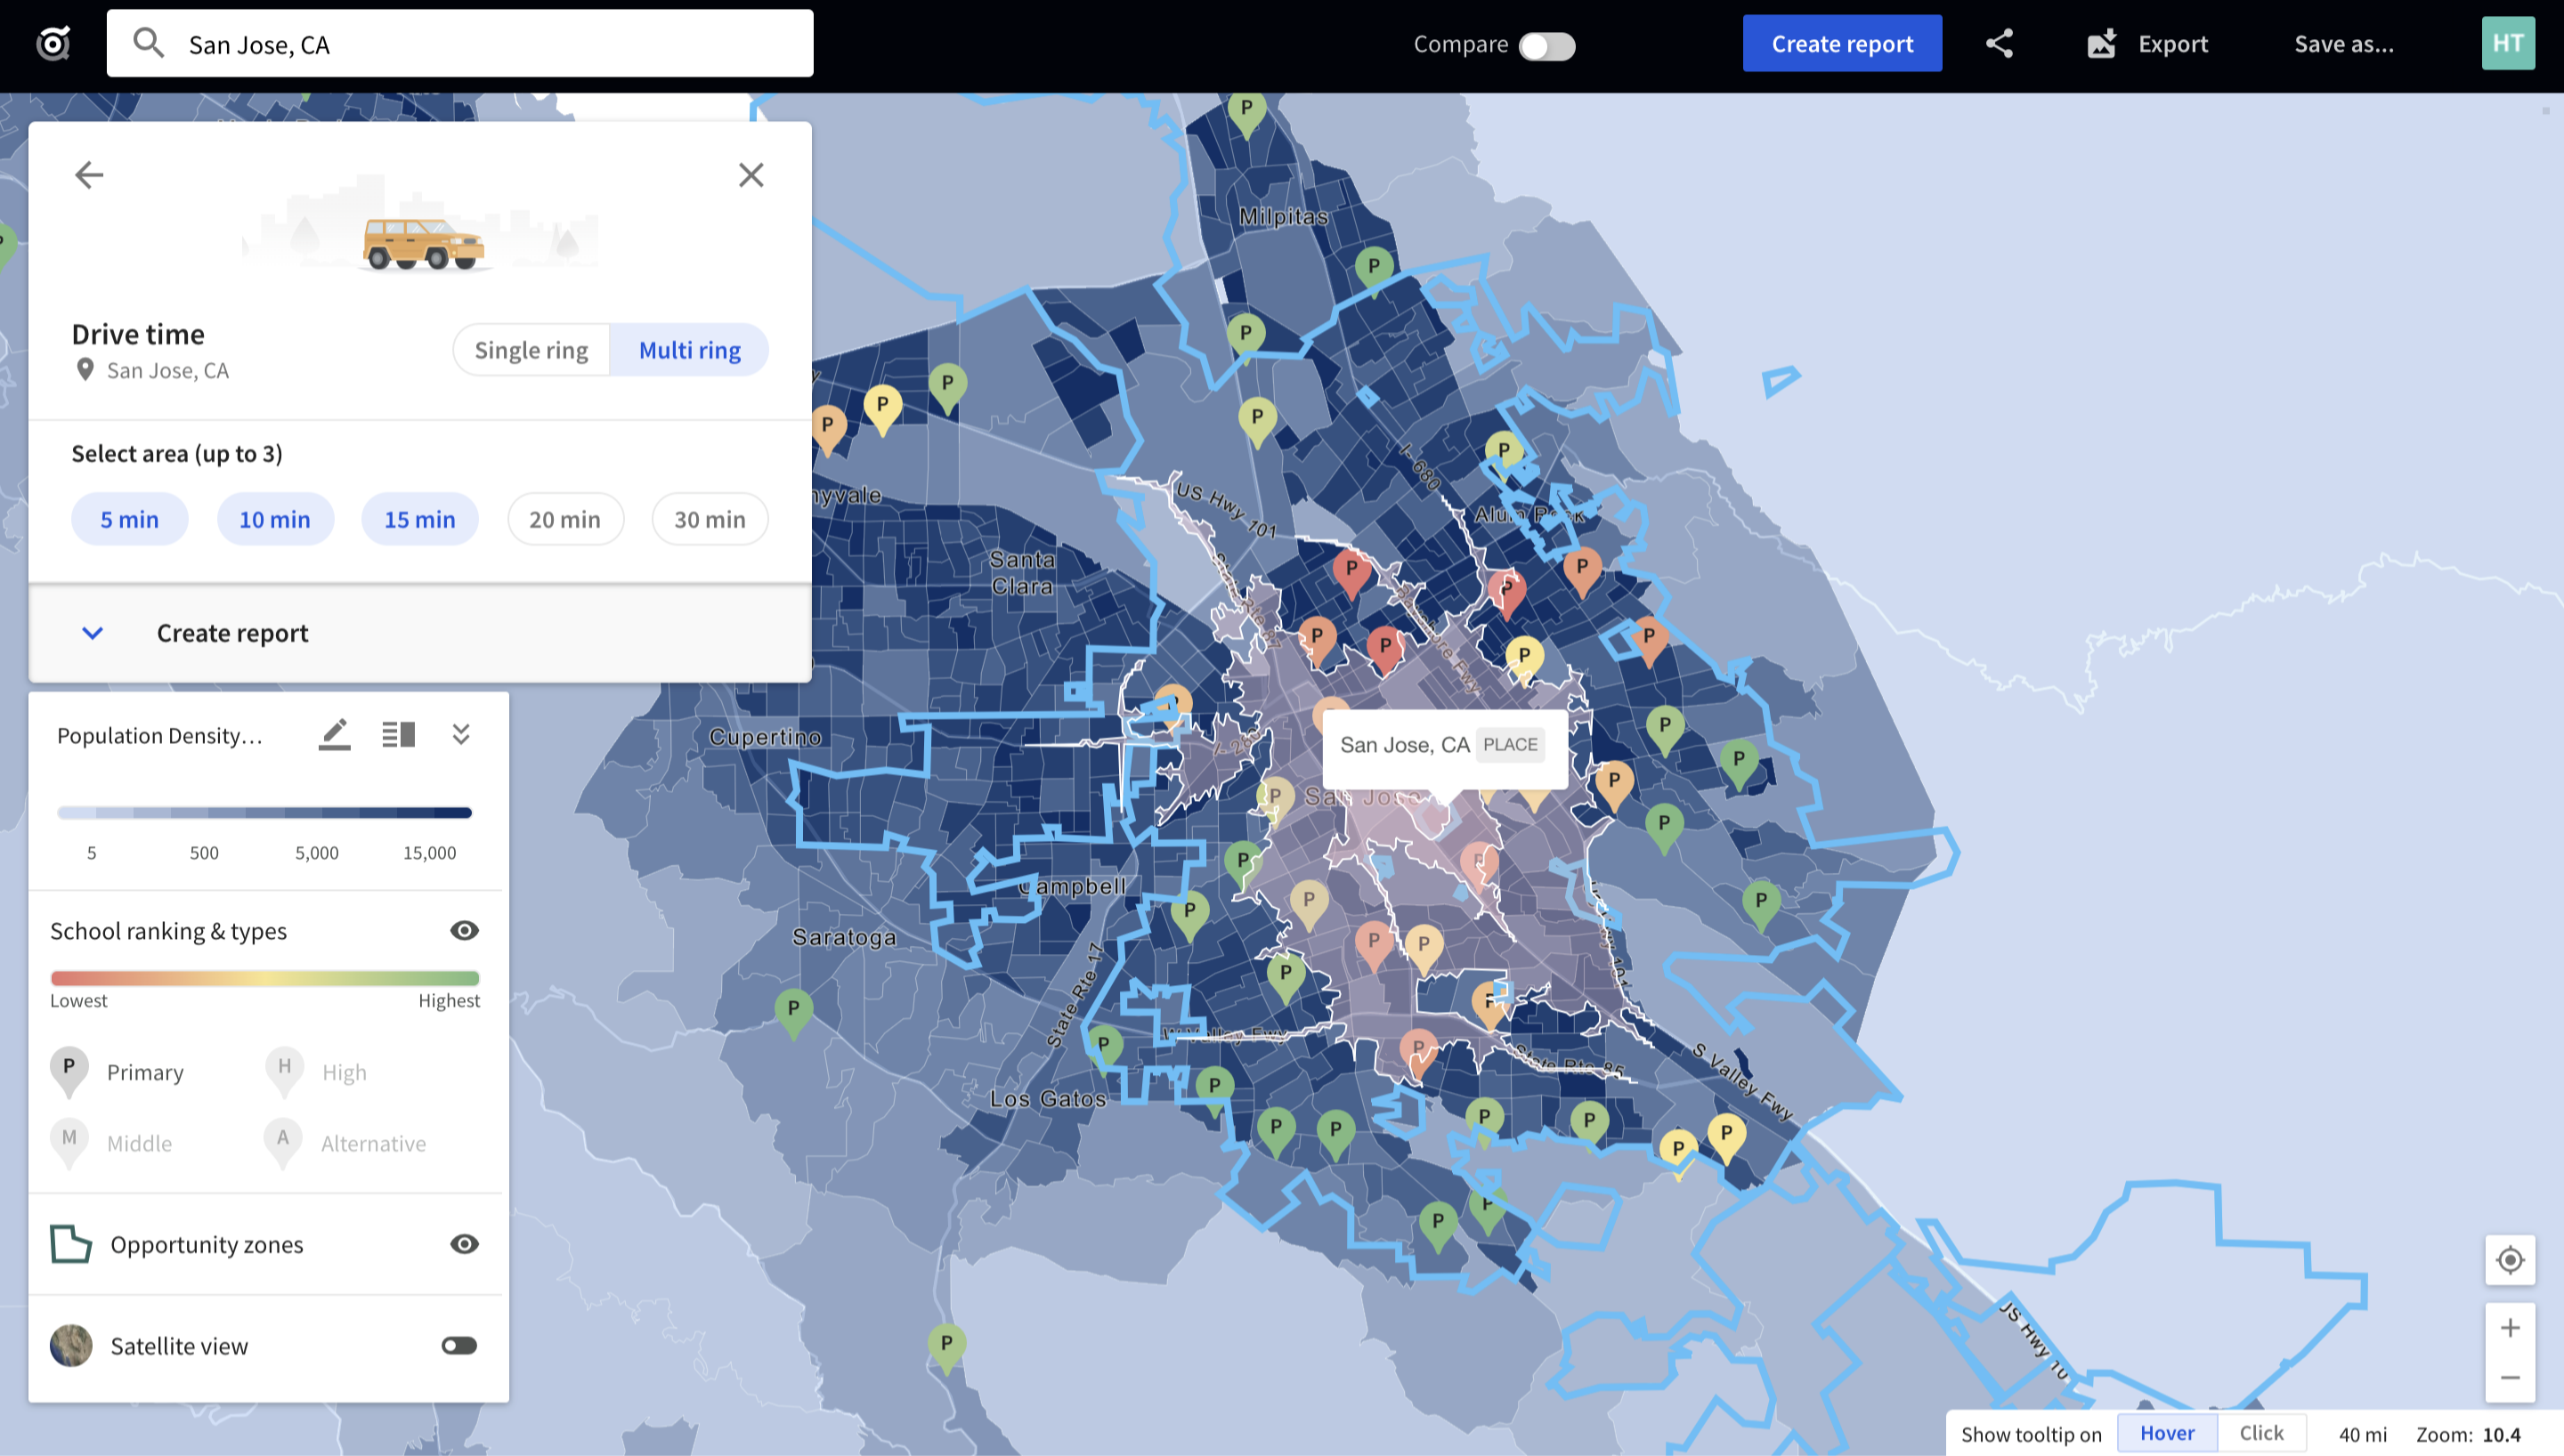
Multi ring allows you to choose up to three radiuses
When all of your variables have been selected, you are ready to create your report. To do so, click “create report.” You will then have the option of choosing additional data such as selecting years for comparison (you can select up to two different years) and also selecting the topic/report of your liking. When complete, click “create report” once more to generate your report with your chosen variables. Reports will open in a seperate tab and are available for download in CSV or Excel and can also be shared through the shareable link.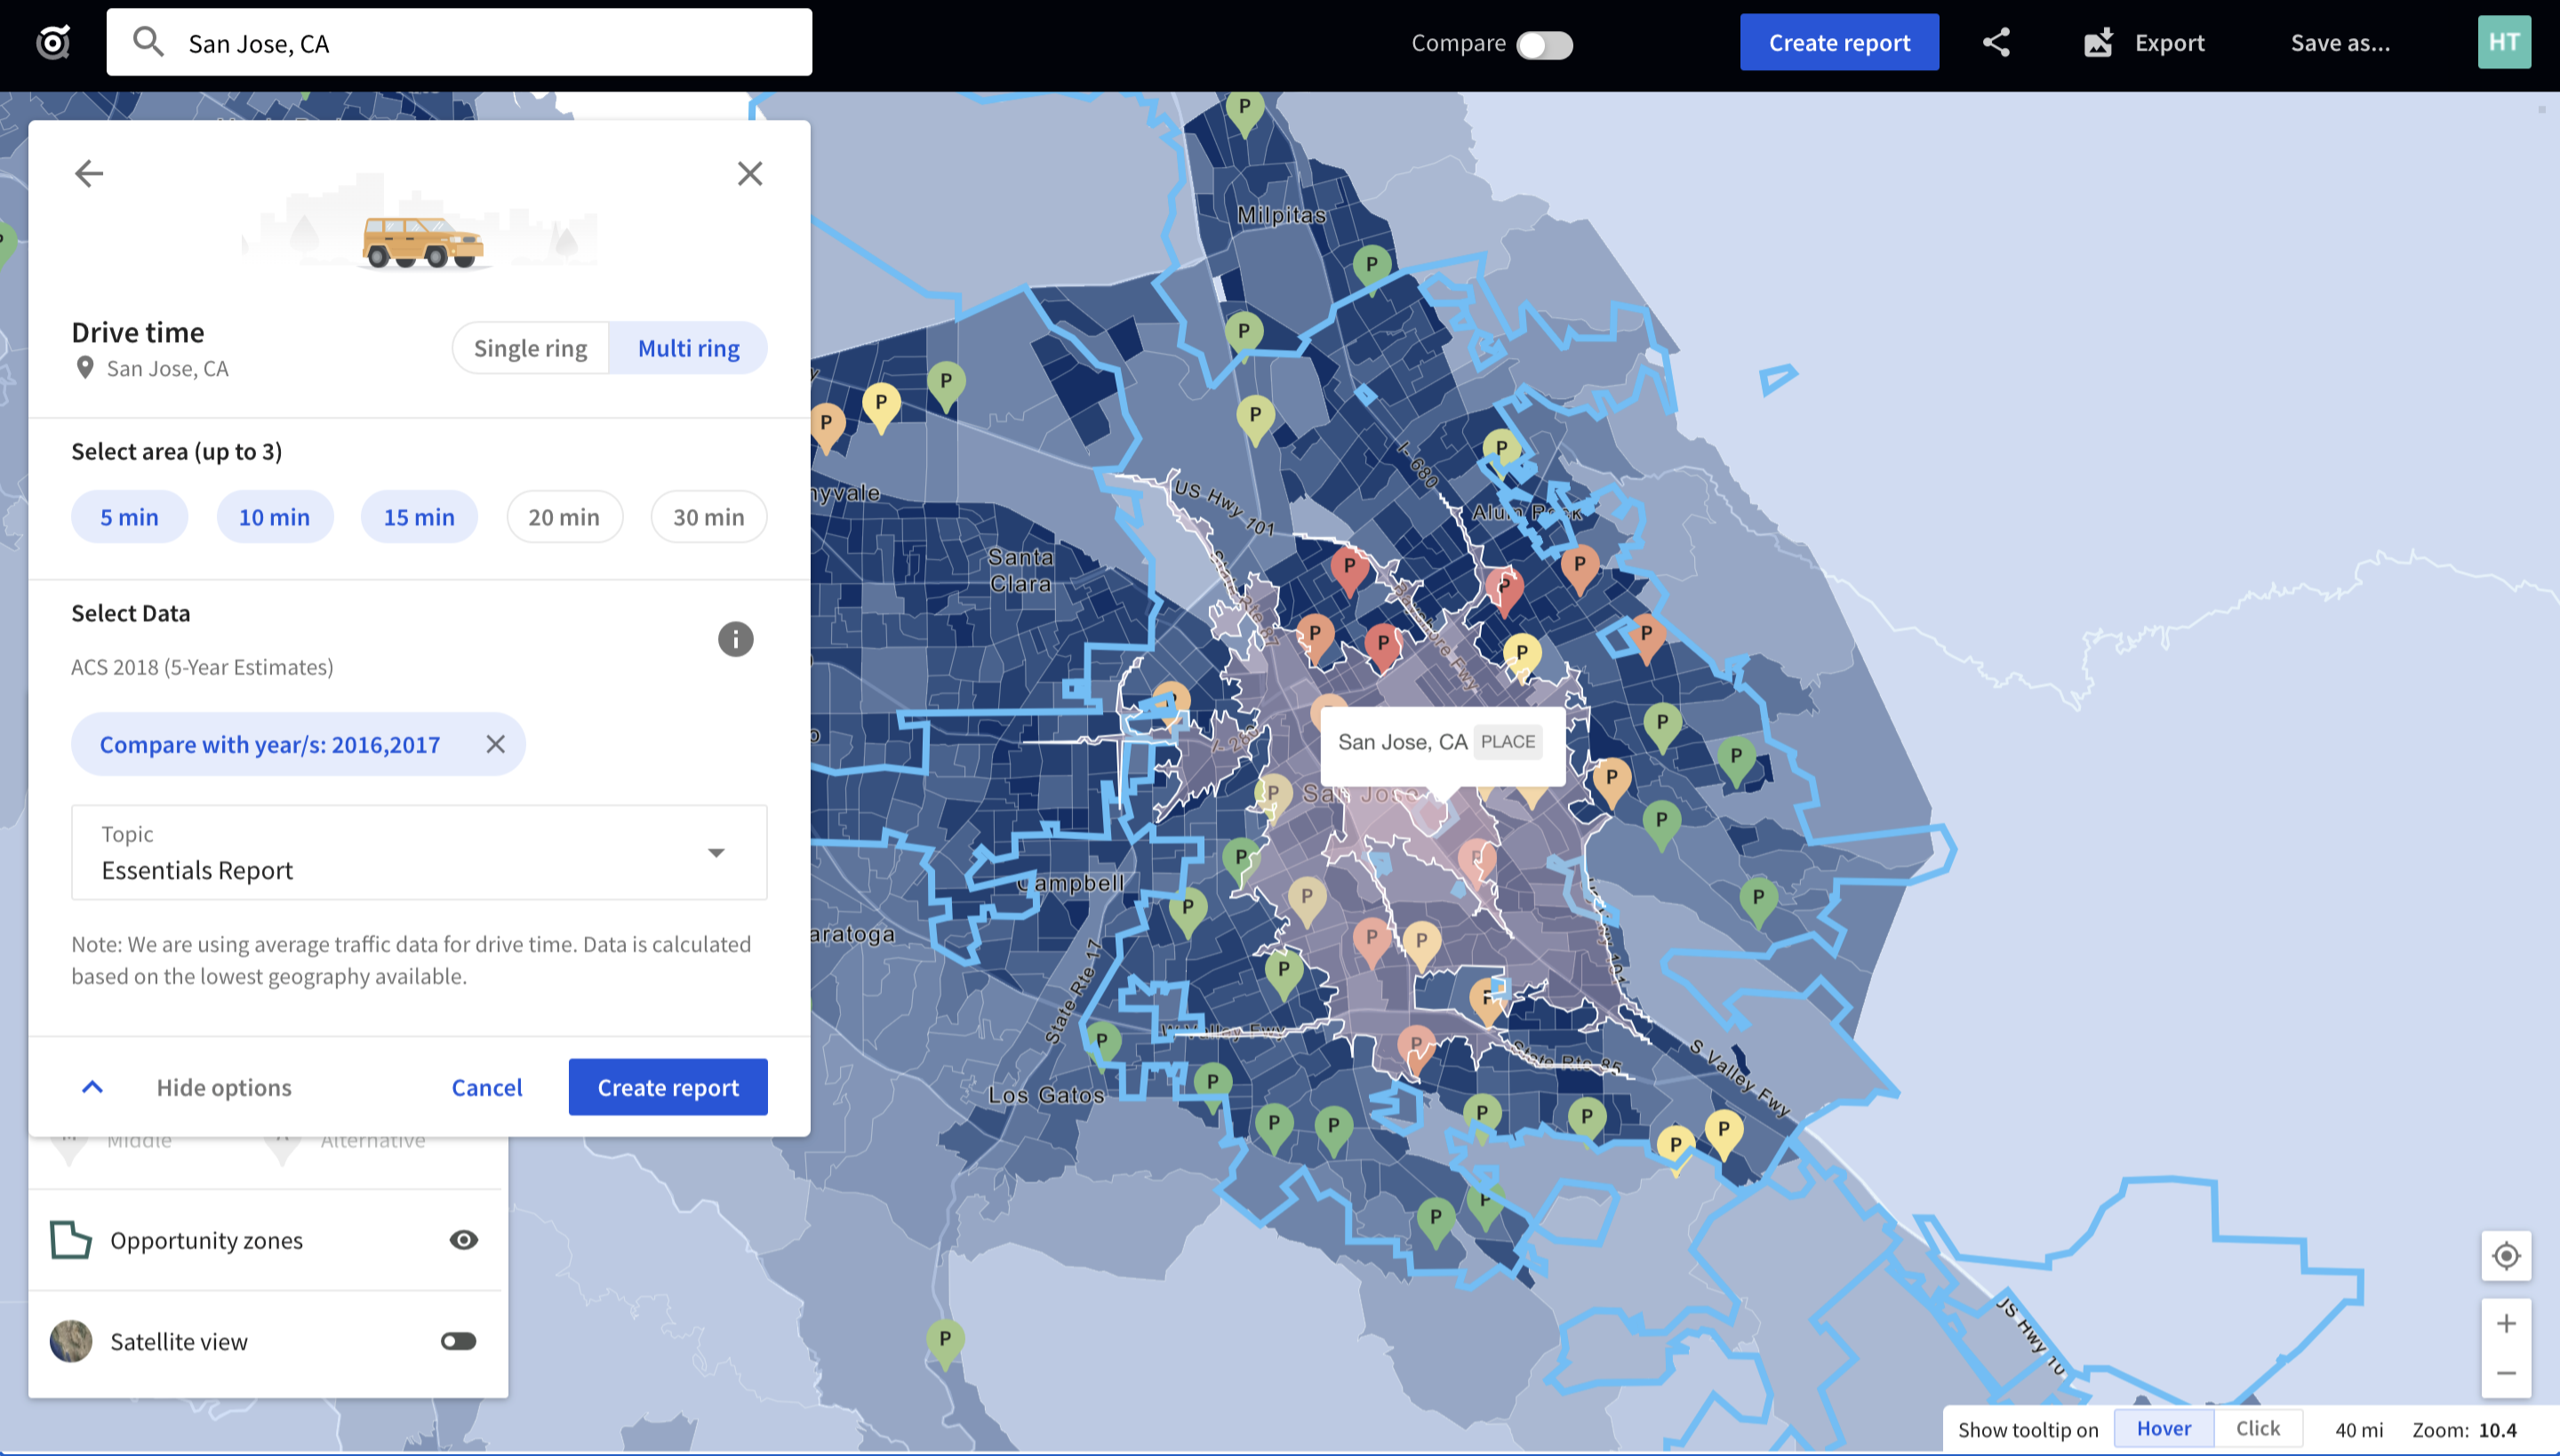
Select up to 2 years to compare data and also the topic/report style of your liking
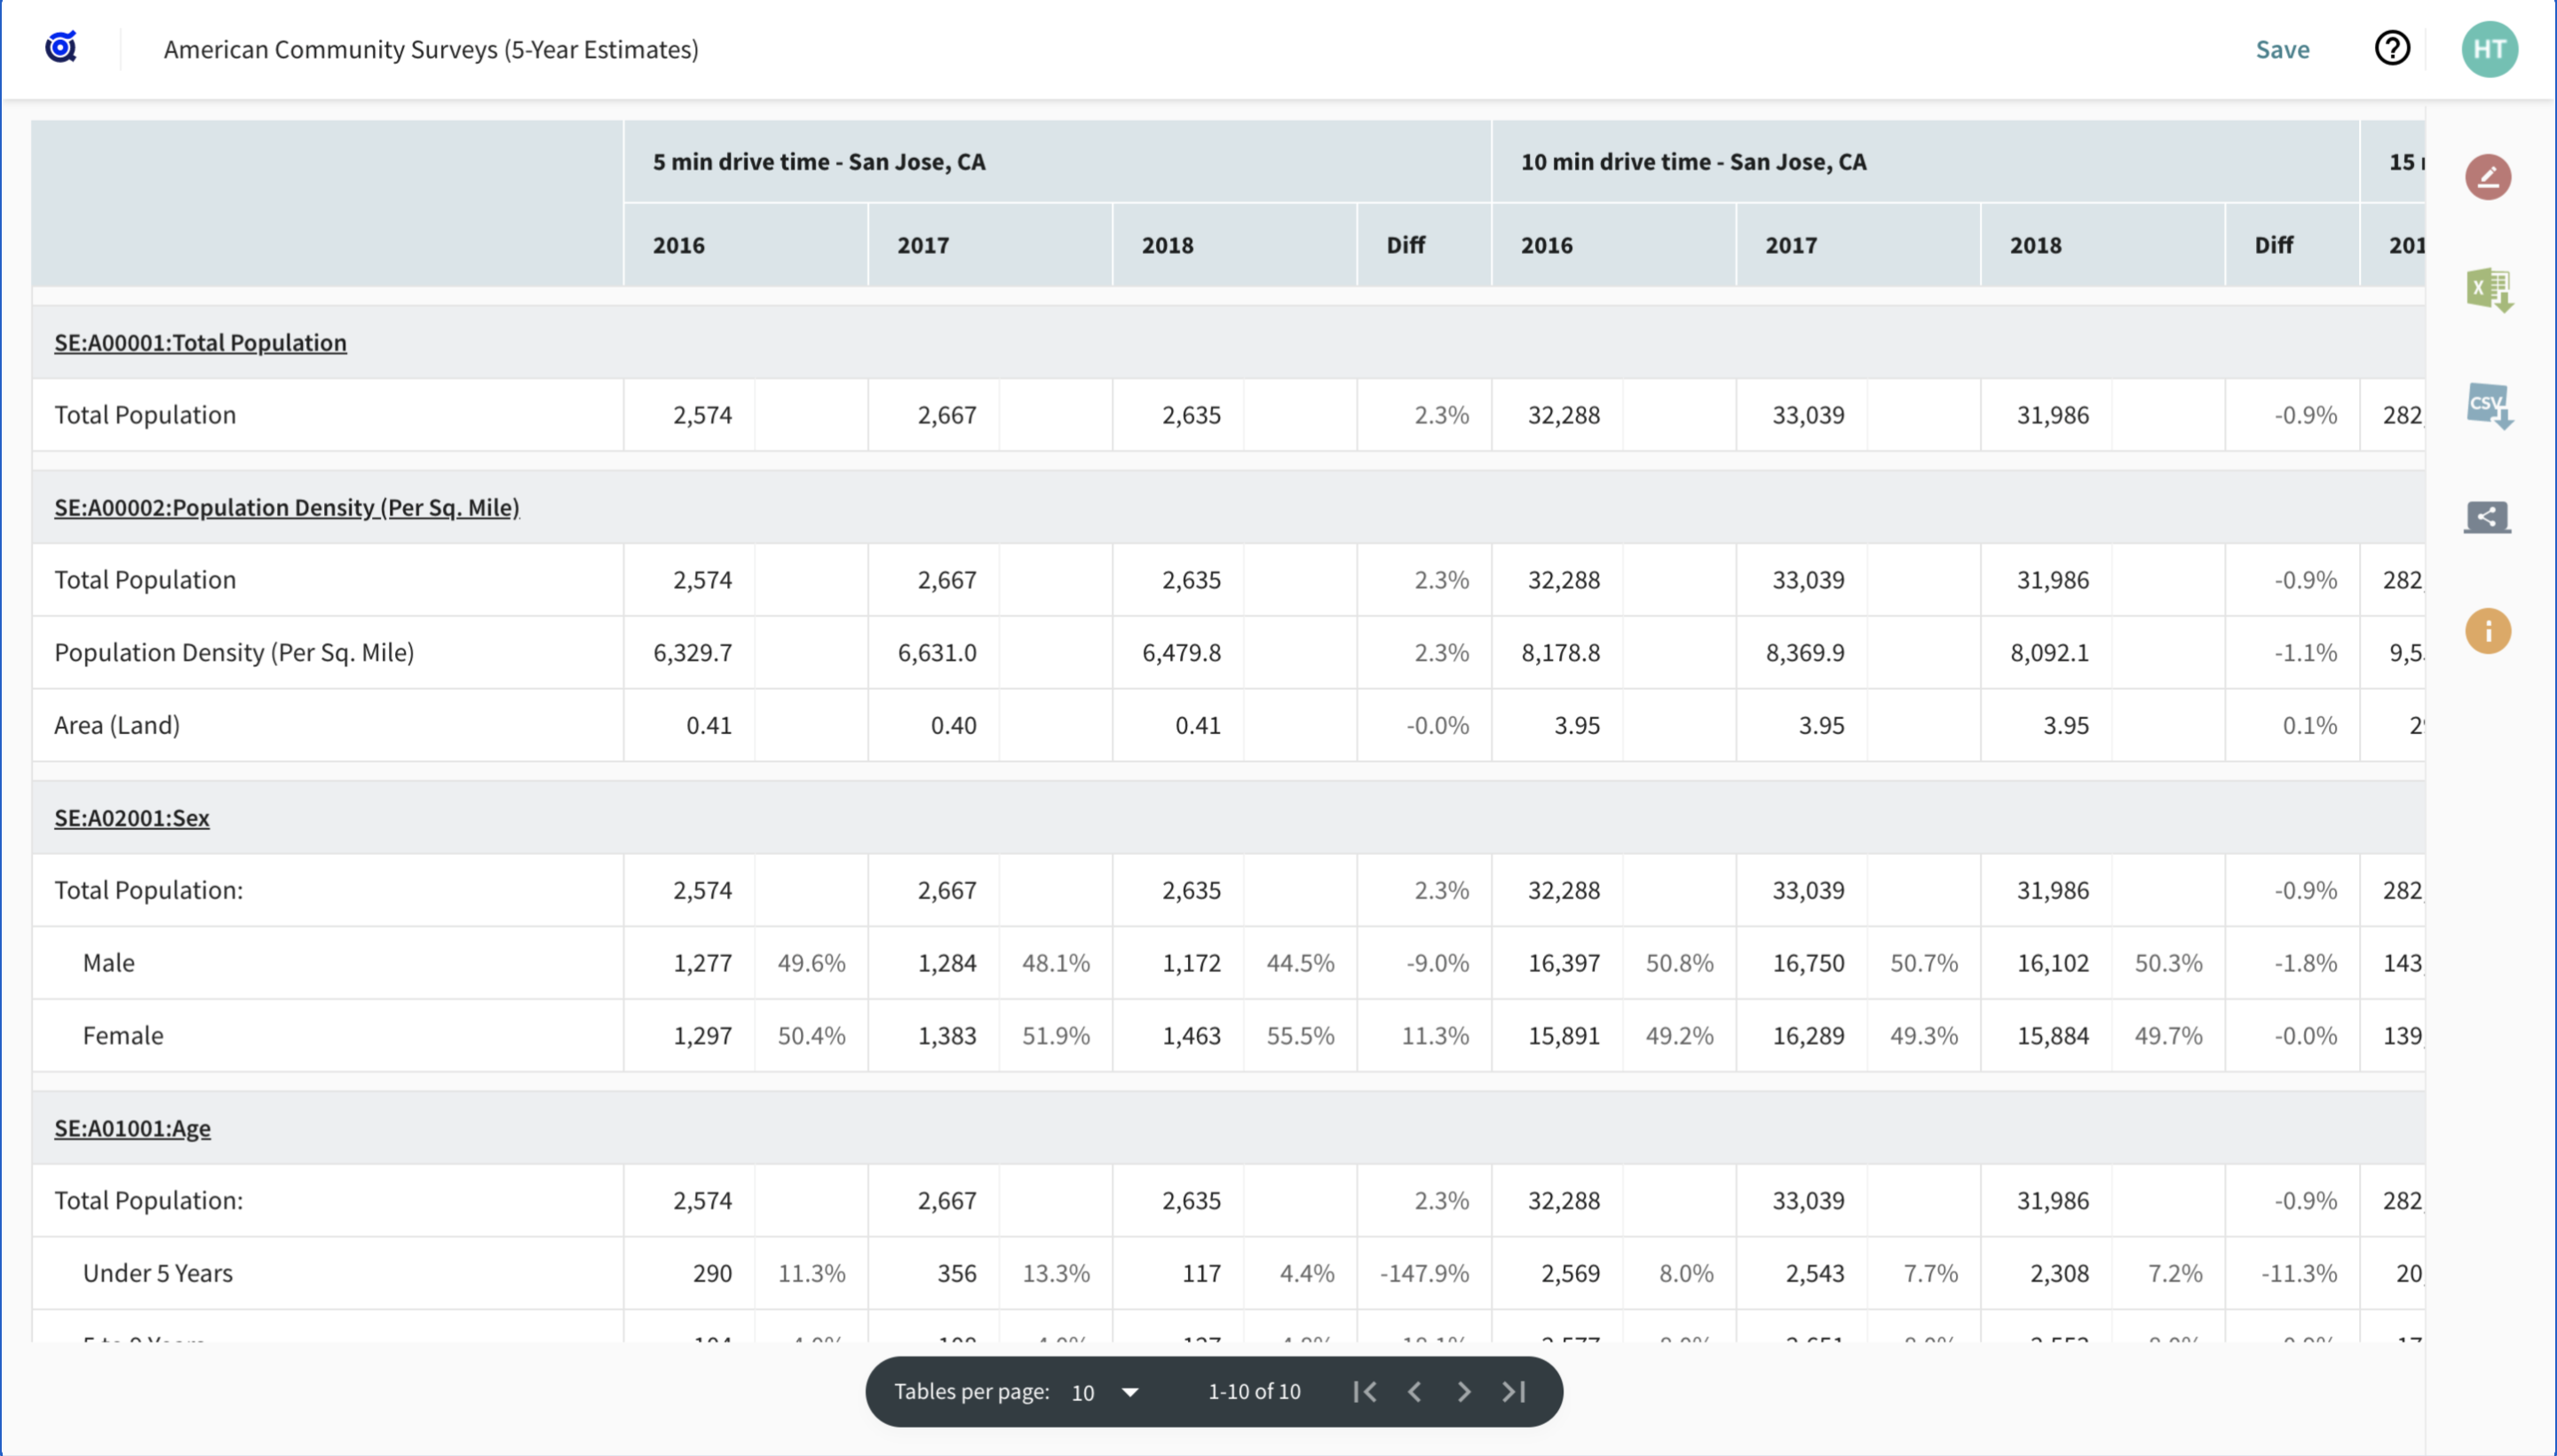
Generated reports will appear in a separate tab and are available to share and download
Evaluating data and trends tend to be extremely time-consuming, yet TractIQ allows you to quickly compare areas and indicators with complete ease and no previous GIS experience!
Not only does TractIQ efficiently help you complete radius and drive time analyses, it also provides compelling maps to help you visualize trends in your report. These live images are easily shareable with any of your stakeholders, who will have the ability to further manipulate images rather than looking at static visuals.
Author: Hana Trokic