Our thorough business, demographic, and location data not only provide insights into past and current trends in an area, but also accurate and accessible market projections through 2025.
“How are income levels expected to change in the next five years?” “Where’s the best place to put a multi-family senior housing development? “On what and where are consumers spending their money?”
Map and visualize answers to these questions and more through our market-specific, curated data.
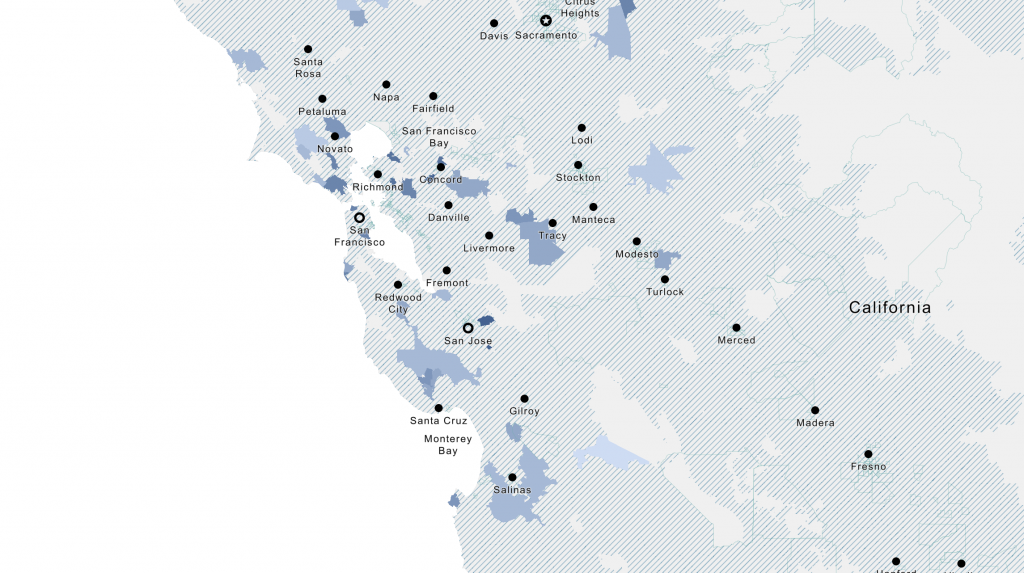
Filter Areas by Criteria
TractIQ’s data filtering tool, Filter Areas by Criteria, allows you to filter geographies by data and identify locations based on your search parameters. Examine relationships and trends among different data points from the broadest to the most granular levels of geography all on a single map.
Filter Areas by Criteria
TractIQ’s data filtering tool, Filter Areas by Criteria, allows you to filter geographies by data and identify locations based on your search parameters. Examine relationships and trends among different data points from the broadest to the most granular levels of geography on a single map. For example, locate census tracts across the United States where the population is expected to grow by more than 6% in the next five years or find zip codes where the number of vacant housing units for rent is less than 2% of the total number of vacant housing units and the median gross rent is greater than $1500.
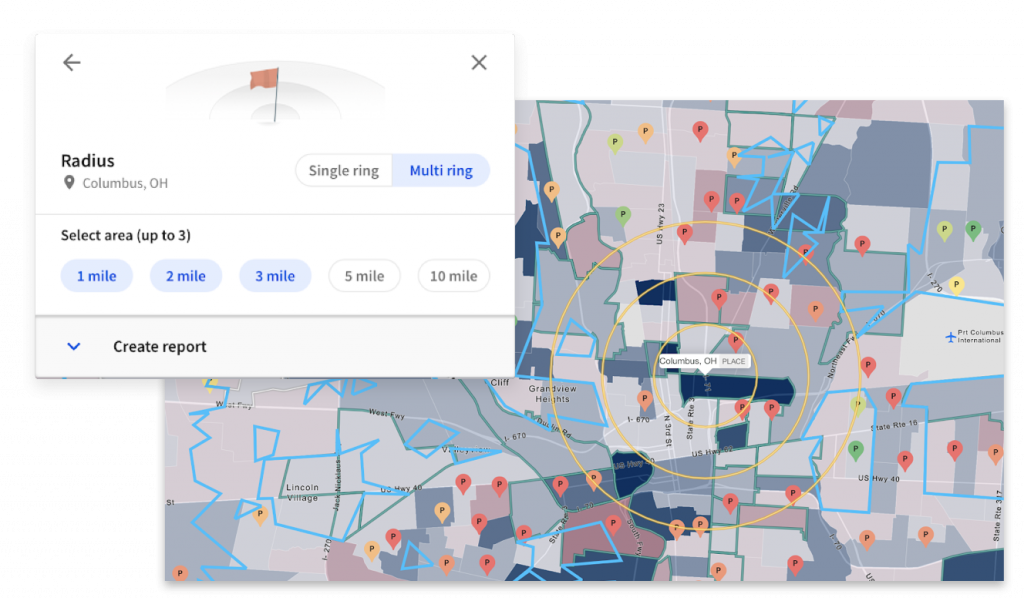
Analyze Radius or Drive Time Around Your Target Area
TractIQ allows you to enter an address and analyze data for multiple distances around your current property or potential acquisition site. Visually compare smaller areas within these distances and run reports to evaluate current data, projections, and trends over time to determine if there is appropriate demand in the area.
Comprehensive Historical Data
Anchor your development decisions in reliable historical data. TractIQ’s trusted demographic and economic historical data give you a competitive advantage in due diligence for current and projected developments. Robust and intuitively accessed, our data includes over 500,000 indicators across demography, economy, consumer spending, health, housing, education, and more.
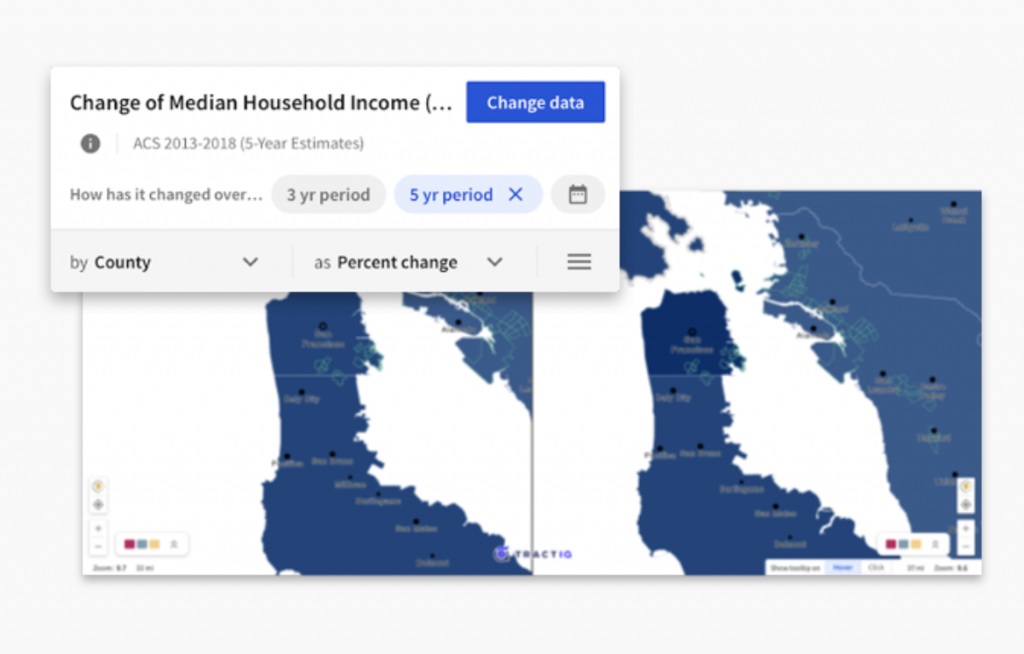
See Change Over Time to Understand Historical Trends
With TractIQ’s Change Over Time feature, you can easily understand how human, economic, and business behaviors have changed over a period of 3, 5, or 9 years. Accessible on all our maps, view these changes through side-by-side or swipe maps to quickly visualize and understand trends in commercial real estate market data.
See Change Over Time to Understand Historical Trends
With TractIQ’s Change Over Time feature, you can easily understand how human, economic, and business behavior has changed over a period of 3, 5, or 9 years. Accessible on all our maps, view these changes through side by side or swipe maps to quickly visualize and understand trends in commercial real estate market data.
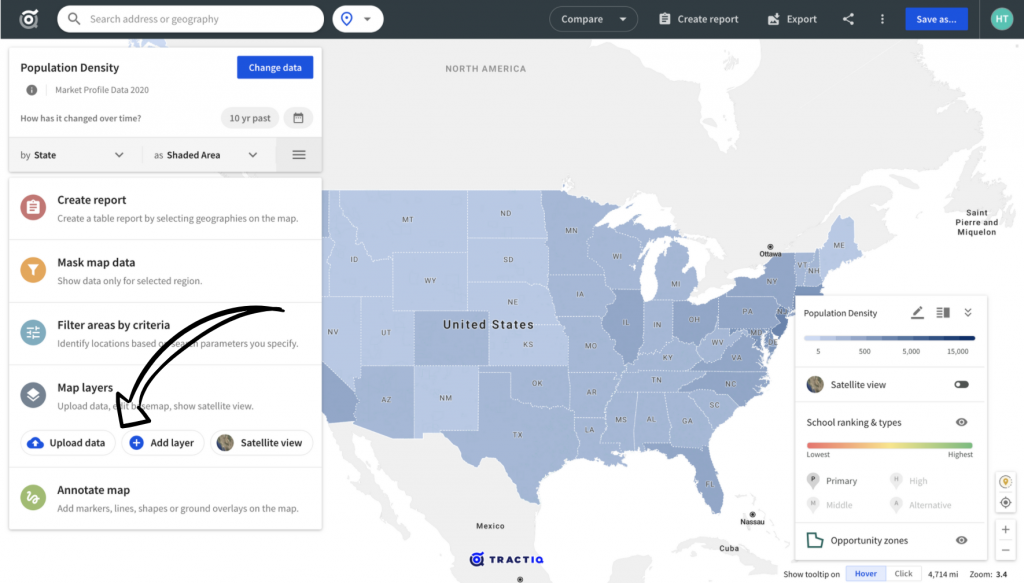
Optimize Your Own Data
TractIQ allows you to upload your own point data and integrate it with our robust mapping and data capabilities. Use our fully customizable platform to efficiently assess commercial real estate market intelligence across the U.S.
Captivating Maps and Visualizations that Illustrate Opportunity
Engage stakeholders with dynamic, customized maps to illustrate key metrics. TractIQ’s unmatched mapping visualizations provide you with an efficient visual analysis of one or multiple sites and allow you to evaluate successful targets and locate areas with matching profiles.
You can now uncover new areas across the U.S. that match a specific profile or compare markets easily with a standardized data framework and side-by-side visual analysis. Create confident and compelling materials to support recommendations or share links to dynamic maps to deepen the understanding of stakeholders.
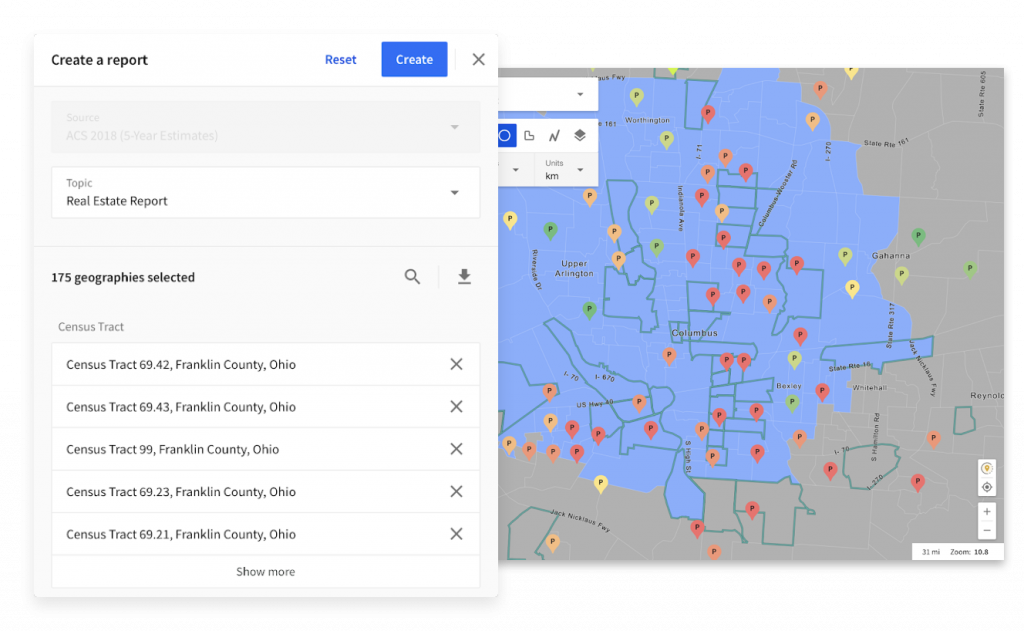
One-Click Location and Custom Market Area Analysis Reports
TractIQ allows you to create reports with just a few clicks through our intuitive mapping interface. Choose your data, topic, and geographies of interest and your report is ready to go!You can also choose from a variety of report templates, ranging from market analysis and Opportunity Zones to commercial real estate and more. In just a few clicks, create customized reports that enrich your business’s market research and analysis.
Our trusted data sources
TractIQ data come from trusted public and proprietary sources. With years of data research and handling experience, we curate and process every data point that goes into our system.
OUR CLIENTS
Contact Us
Let’s talk about how TractIQ can help your business.