How Are REIT Street Rents Outpacing Achieved Rents in 2025?
Download TractIQ’s exclusive Q2 report to see which operators regained pricing power — and what it means for your portfolio.
Key Q2 2025 insights - Data at a glance
Advertised Rates
$20.36
+1.7% YOY (vs $17.99 in Q1)
Street rent growth is rebounding — early signs of pricing power returning.
Street rents are regaining momentum after several quarters of decline.
Advertised rates averaged $20.36 in Q2 2025,
up 1.7% YOY versus $17.99 in Q1—an early signal of
pricing power returning in high-demand metros.
Achieved Rates
$20.71
−3.1% YOY (vs $20.74 in Q1)
Post-pandemic churn normalizing as higher in-place tenants cycle out; move-in rates stabilizing.
Achieved rates averaged $20.71 in Q2 2025, a
3.1% YOY decline. This reflects normalization as
pandemic-era, higher in-place tenants cycle out and move-in pricing stabilizes—healthier turnover and more
predictable revenue mix.
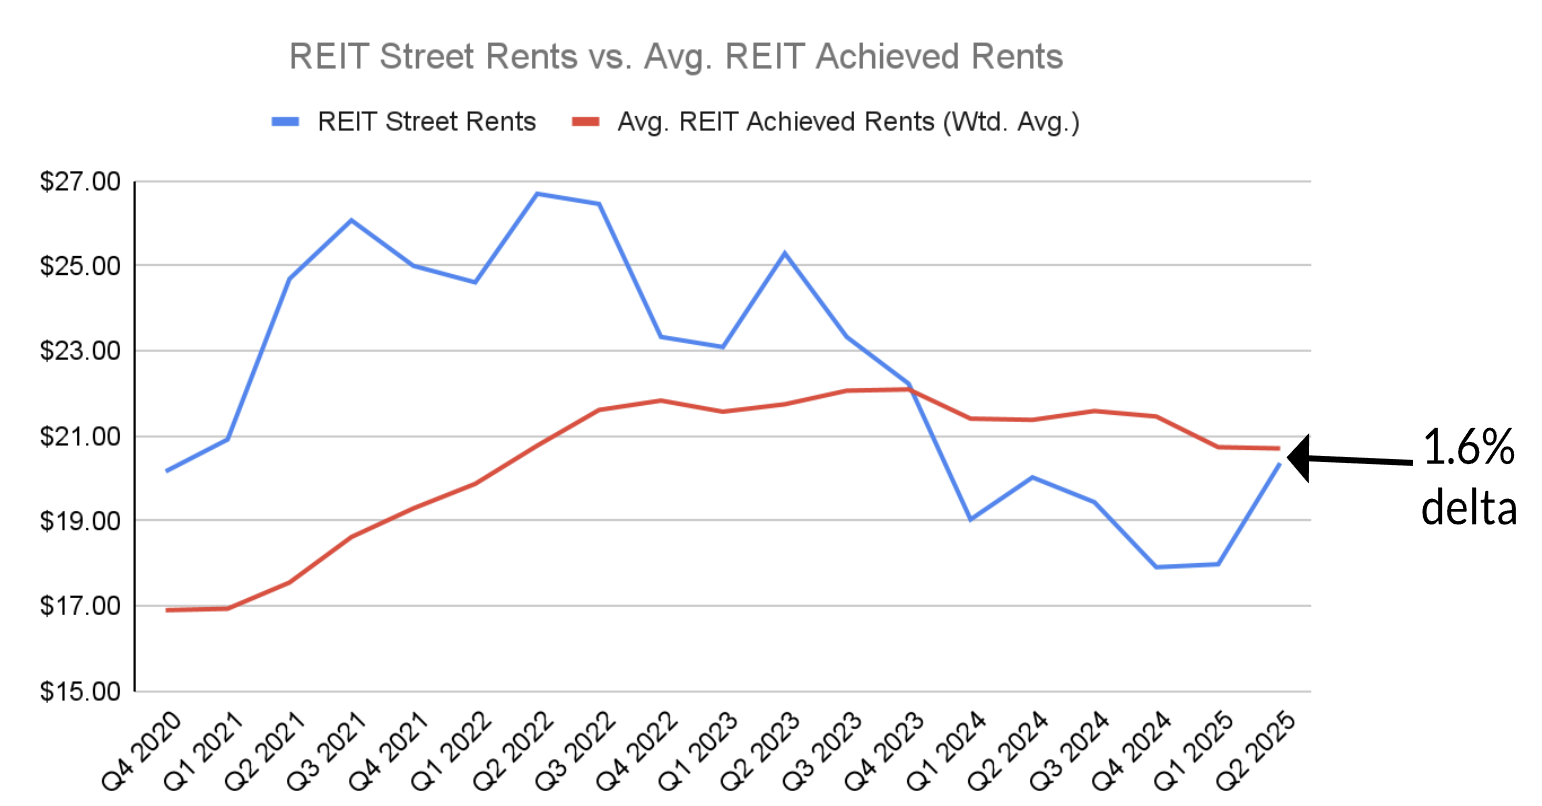
Street vs Achieved Delta
1.7%
↓ 73.6% YOY (from 6.3%)
The narrowest spread in years → higher predictive accuracy for underwriting (esp. Extra Space & NSA).
The gap between street and achieved rents compressed to
1.7% in Q2 2025—a
73.6% narrowing YOY from 6.3%.
This convergence strengthens street rates as a leading input for underwriting,
especially for portfolios like Extra Space and NSA.
Discount Rate
23.7%
+13.8% YOY (vs 23.6% in Q1)
Discounting remains steady, reflecting competitive pressure and muted demand despite rate shifts.
Discounting remained steady at
23.7% in Q2 2025
(vs 23.6% in Q1; +13.8% YOY).
The pattern suggests muted demand but persistent competitive pressure as operators balance occupancy
objectives with disciplined price controls.