
The self-storage industry continues to show resilience in the face of headwinds pressuring the market.
Each self-storage REIT expressed cautious optimism heading into 2025 while remaining vigilant in operations during a challenging economic and housing environment.
KEY FACTS:
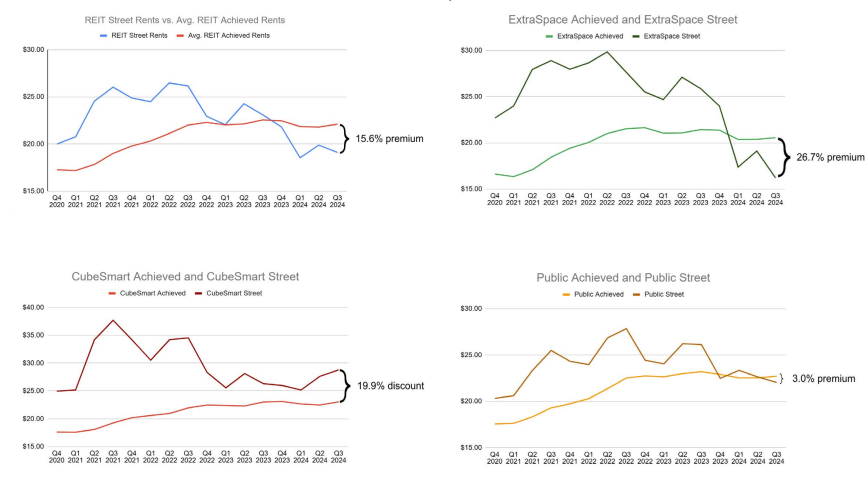
- Extra Space in-place rates are 26.7% above their advertised rates
- Public Storage in-place rates are 3.0% above their advertised rates
- CubeSmart in-place rates are 19.9% below their advertised rates
Get the complete set of charts, tables, and REIT-by-REIT details delivered instantly.
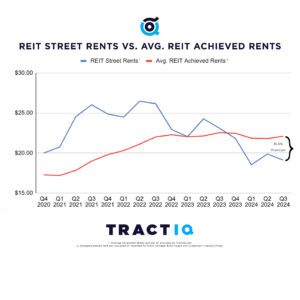
Street Rates vs Achieved Rents
REITs are using deep move-in discounts to stay competitive, but they’re protecting in-place revenue through stronger renewal pricing. The result: achieved rents sit well above advertised street rates across portfolios.
- Move-in discounts widen the gap between street and achieved rents.
- Renewal strategies and ECRIs are doing the heavy lifting for revenue.
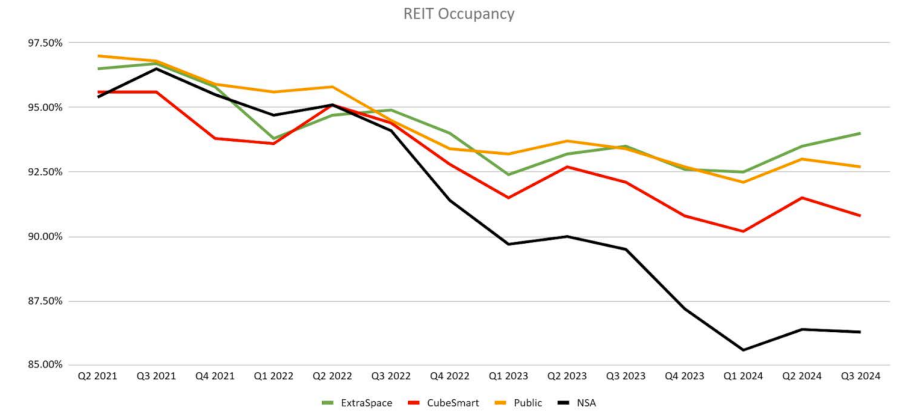
Occupancy Stabilization Signals a Slow Recovery
Occupancy has come down from peak levels, but by Q3 2024 the declines slowed and some portfolios started to level out. The sector is still below historical highs, yet trending toward a slow, steady recovery.
- ExtraSpace leads with the highest occupancy among the major REITs
- Sun Belt-heavy portfolios continue to feel the most pressure.
Same-Store Performance
Revenue Growth
Slight year-over-year declines as weaker move-in volumes offset stable in-place rents.
Expense Growth
Operating costs remain elevated, driven by taxes, insurance, and maintenance.
NOI
Same-store NOI is under pressure, generally down low-single digits year-over-year.
Rent Per Occupied SF
Rent per occupied unit is largely flat, highlighting the strength of existing-customer pricing.
Acquisition & Development Activity
REITs remained selective but active in Q3, with more realistic pricing helping deals move while development stayed disciplined.
| REIT | Acquired | Development | Guidance | Key Notes |
|---|---|---|---|---|
| ExtraSpace | $163.9M | JV deals | $500M | Strong M&A pipeline |
| CubeSmart | $22M | 2 NY dev sites | $100–200M | Urban infill focus |
| Public Storage | $46.2M | $426.7M dev | $350M | Digital push |
| NSA | $147.6M JV | Miami | $100–300M | Large Sunbelt footprint |
Best & Worst MSAs
Performance diverged widely by metro—some markets posted strong gains, others are still struggling with oversupply.
Top Performers
- Hartford, CT – Strong rent growth and improving occupancy.
- Washington, DC – Solid recovery in rent per occupied unit.
- Seattle & Phoenix – Among the leaders in occupancy gains.
Underperformers
- Indianapolis, IN – One of the steepest rent declines.
- Cape Coral–Fort Myers & Sarasota, FL – Ongoing rent and occupancy pressure.
- Atlanta, GA – Softer performance driven by competitive supply.
Insights
“We’re seeing solid occupancy and strong performance from our third-party and JV platforms, even in a more competitive leasing environment.”
“New-customer rates are aggressive, but our existing customers continue to behave well and support stable cash flows.”
“Internalizing our PRO structure and centralizing marketing are positioning us for better long-term execution.”
Q3 Market Themes
Pillar 1 – Demand Resilience
Core demand is holding up despite macro headwinds.
Pillar 2 – ECRIs & Stickiness
Existing-customer rate increases and longer stays are key revenue drivers.
Pillar 3 – Digital-First Leasing
Most new customers now start online, enabling leaner operations and better pricing control.
Pillar 4 – Supply & Capital Constraints
New development is limited, while acquisition opportunities are slowly improving.