
A Challenging 2024 for Self-Storage Operators
2024 put self-storage operators to the test. Street and web rates were heavily discounted, property taxes surged, and operators struggled to reconcile headline prices with achieved rents and existing-customer rate increases. This report uses TractIQ data and REIT filings to cut through the noise so you can underwrite and operate with confidence.
Key Takeaways From Q4 2024
A few numbers tell the story of just how unusual 2024 was for storage REITs:
- REIT advertised rates decreased by 18.4%, and rent per occupied SF decreased by 2.3% since 4Q23
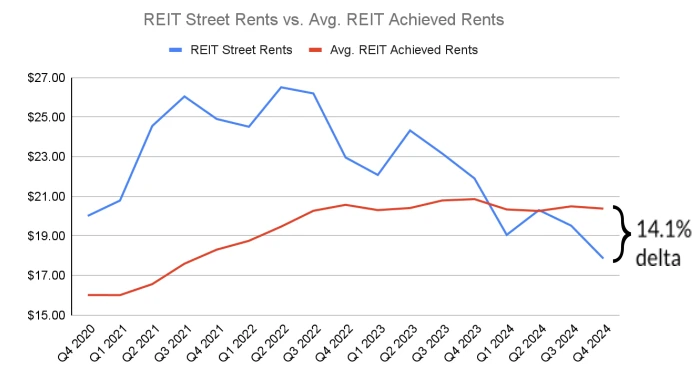
- REIT advertised rates were 14.1% lower than REIT achieved rates
- The REIT discount rate (% difference between street and web rates) was 41.1% in 4Q24. This figure was 43.4% 1 year ago and 26.4% 2 years ago
- On average, REIT same-store portfolios experienced a 14.3% increase in property taxes year-over-year
- 2024 REIT Street Rate Trends (10×10 NCC) – Top 3 and Bottom 3 MSAs
- Las Vegas, NV: 13.9% decrease
- Austin, TX: 11.6% decrease
- Louisville, KY: 11.0% decrease
- Tampa, FL: 20.6% increase
- San Francisco, CA: 12.7% increase
- St. Louis, MO: 11.7% increase

Street vs Achieved Rents: Mind the Gap
By Q4 2024, achieved rents on occupied units sat well above discounted street rates. Heavy move-in discounts helped REITs stay competitive on new customers, while existing-customer pricing and ECRIs sustained revenue. The result is a durable rent premium even in a tough demand environment.
- Achieved rents maintained a mid-teens premium over street rates.
- Deep discounts are concentrated at the point of move-in, not on in-place customers.
- Understanding this gap is critical for underwriting “true” market rents.
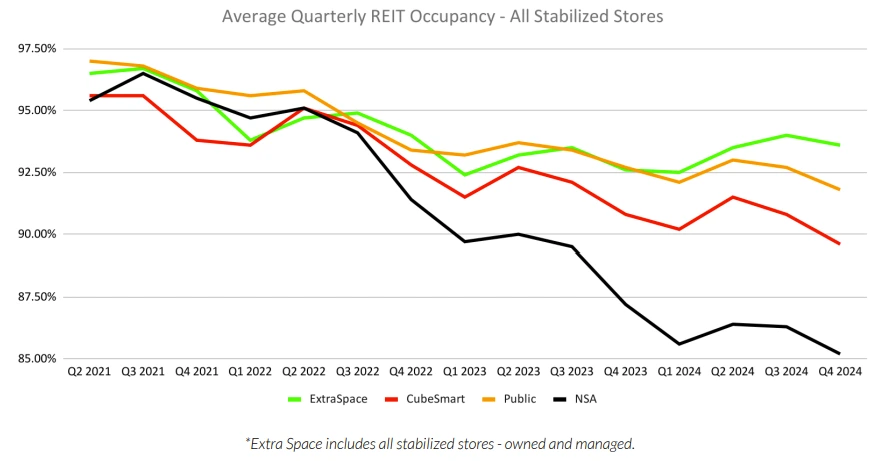
Occupancy: Off the Peak, But Stabilizing
Same-store occupancy has receded from the pandemic highs, but the Q4 numbers suggest a slower pace of decline. Extra Space remains in the low-to-mid 90s, while NSA trails in the mid-80s, with CubeSmart and Public in between. Operators are managing lower occupancy while waiting for demand to normalize.
- Extra Space closed Q4 with about 94% same-store occupancy.
- CubeSmart and Public were roughly 89–91%.
- NSA, with more exposure to tougher markets, finished around 84%.

Same-Store Performance & Rent Per Occupied SF
Same-store revenue and NOI declined modestly in 2024 as rising expenses—especially property taxes—outpaced flat to slightly negative rent growth. Rent per occupied square foot stayed remarkably stable, underlining how much existing-customer pricing is carrying performance.
- Revenue: Same-store revenue declined roughly 1–2% year-over-year across most REITs.
- Expenses: Same-store expenses rose, with property taxes up by mid-to-high teens in some portfolios.
- Rent/SF: Same-store rent per occupied SF was nearly flat, within ±2% for most REITs.
Acquisition & Development Activity
Despite a noisy macro backdrop, REITs remained active—but selective—on acquisitions and developments in 2024. Pricing expectations are gradually aligning, and 2025 guidance points to a cautious reopening of the transactions market.
Best & Worst MSAs in 2024
Market performance diverged sharply. Some MSAs delivered strong rent and occupancy growth, while others were hit by heavy discounting and new supply.
Top Performers (Rent / SF & Occupancy)
Underperformers
What REIT Leaders Are Saying
Management commentary across the major REITs points to a difficult but slowly improving backdrop
“We expect much of the same in 2025—a challenging but slowly improving operating environment, supported by growth in third-party management and ancillary businesses.”
“YOY declines are moderating and fundamentals are gradually improving, but there’s no obvious near-term catalyst for a sharp demand rebound.”
“We believe we’ve bottomed out on year-over-year performance and are positioning the platform to benefit disproportionately as fundamentals recover.”
2025 Outlook: Four Themes to Watch
Discounting Remains Elevated
Web and street discounts are likely to stay wide as operators compete for move-ins, even as they defend achieved rents.
Expense Pressure, Especially Taxes
Property taxes and insurance are still pushing expenses higher, keeping NOI growth constrained even if revenue stabilizes.
Supply Growth Is Slowing
New development is harder to pencil, which should gradually help fundamentals and pricing power into 2025–2026.
Digital & Third-Party Platforms as Growth Engines
REITs are leaning into digital leasing, third-party management, and structured investments to drive incremental FFO even in a flat demand environment.
Frequently Asked Questions
What’s the biggest story in this Q4 2024 report?
The widening gap between heavily discounted street/web rates and relatively stable achieved rents, combined with rising operating costs and uneven market performance.
Why aren’t advertised rates a reliable view of “true” market rent?
Advertised rates are often deeply discounted move-in promotions; achieved rents reflect renewal pricing and ECRIs on customers who stay longer, which is where most revenue lives.
How should investors and operators use this report?
Use it to benchmark REIT strategies, understand discounting and expense dynamics, and identify which MSAs are leading or lagging on rent and occupancy.