
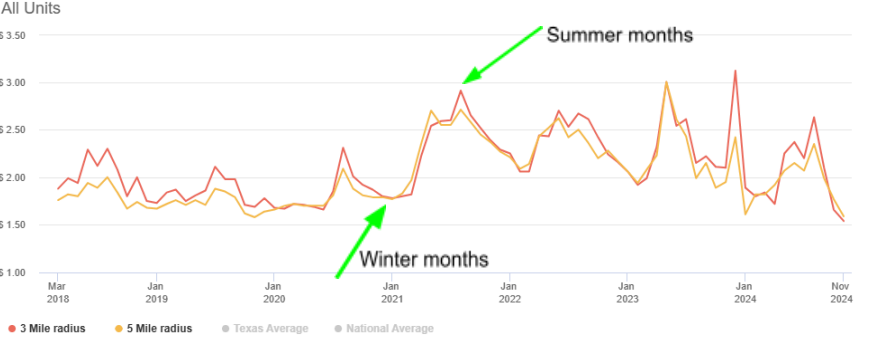
You’ll see that advertised rates can change as much as 30% or more within a year’s time because operators are constantly adjusting pricing strategies to reflect the demand in the market. With a high student population in Austin, there’s a predictable summer surge in demand that operators respond to in real-time.
Due to the fast-paced nature of self-storage operations, advertised rental rates and in-place rental rates vary widely at the facility level, let alone within a submarket. Advertised rates can tell us a lot about self-storage demand.
Before diving into the insights these rates can provide, let’s define some key terms that are foundational to understanding self-storage pricing dynamics:
Web Rates: The rates advertised online, often discounted to attract price-sensitive shoppers. These typically include short-term promotional pricing.
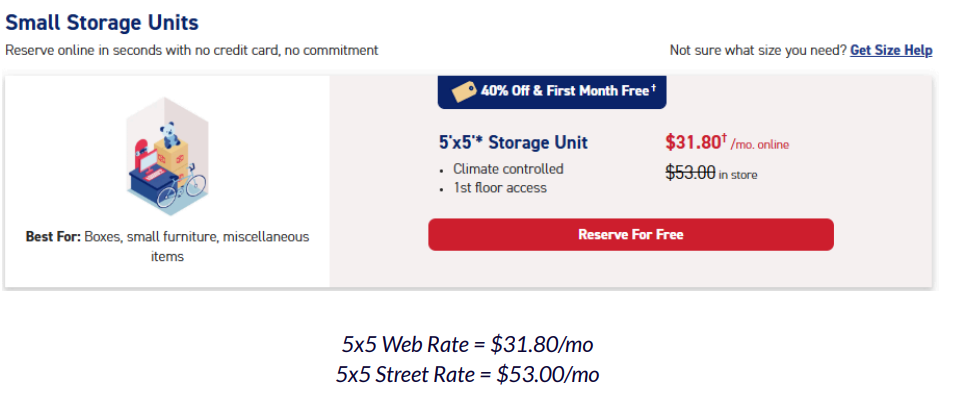
Street Rates: The street rate for a particular unit is the rate that a customer would be charged if they were to walk in off the “street” and rent a unit in person at the facility. Given that customers are less likely to price-shop in this scenario, the street rate is typically higher than the web rate.
In-place Rates: The actual rates paid by existing tenants, which can exceed both web and street rates due to regular existing customer rent increases (ECRIs) after the initial promotional period.
See an example below from a CubeSmart facility. TractIQ tracks both the advertised web rates as well as the crossed-out advertised street rate to help investors inform their assumptions.
Now that we have a foundational understanding of web, street, and in-place rates, we can further explore what these rates and their relationship tell us about self-storage demand.
2018 to 2020 (Pre-COVID): Discounting Rose by 50% as Self-Storage Demand Softened and Supply Increased
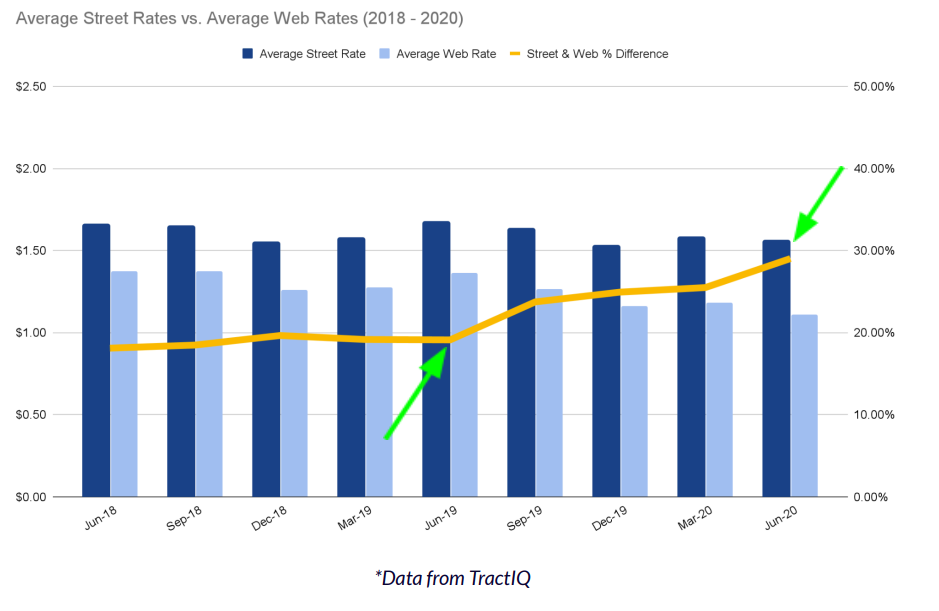
The graph above shows average street rates and average web rates across all unit sizes and facilities in the country from 2018 to 2020. The graph also shows the average difference between the street and web rates aggregated per-unit (yellow line).
In late 2019, demand for self-storage decreased as more uncertainty entered the U.S. market. The uncertainty was fueled by several factors.
- Dramatic policy shifts at the Federal Reserve. The Federal Reserve raised rates four times in 2018 and then decreased rates three times in 2019
- Trade/tariff negotiations with China, Mexico, and Canada
- Fear of a slowing global economy due to trade negotiations and Brexit
- The yield curve inverted that fueled fears of a recession over the next 1-2 years
- U.S. manufacturers reported slower manufacturing activity
At the same time demand for self-storage was softening, new storage supply was beginning to lease up after a record year in 2018. According to the 2020 Self-Storage Almanac, about 600 facilities were delivered in the top 50 markets in 2018. The total value delivered in 2018 was estimated at $5.25B, a 33% increase from 2017. Not only were more facilities being delivered, but the average size of new facilities also increased to 60,000 SF from 54,000 SF the prior year. This added supply eventually led to longer lease up timeframes and increased competition among operators.
Due to the uncertainty, added competition, and a decrease in self-storage demand, operators started discounting web rates as indicated by the upward trend of the yellow line in the graph above. We also observed an immediate spike in April 2020 as COVID picked up and operators drove discounting up to nearly 30% as an immediate response, up from ~20% the year prior, representing a 50% increase.
Broad economic events impact the self-storage industry. As uncertainty and competition are introduced into the market, self-storage demand suffers, resulting in operators discounting rates to attract a now more price-sensitive customer base.
2020 to 2022 (COVID): As Self-Storage Demand Boomed After COVID, Rates Spiked and Discounting Decreased by 50%
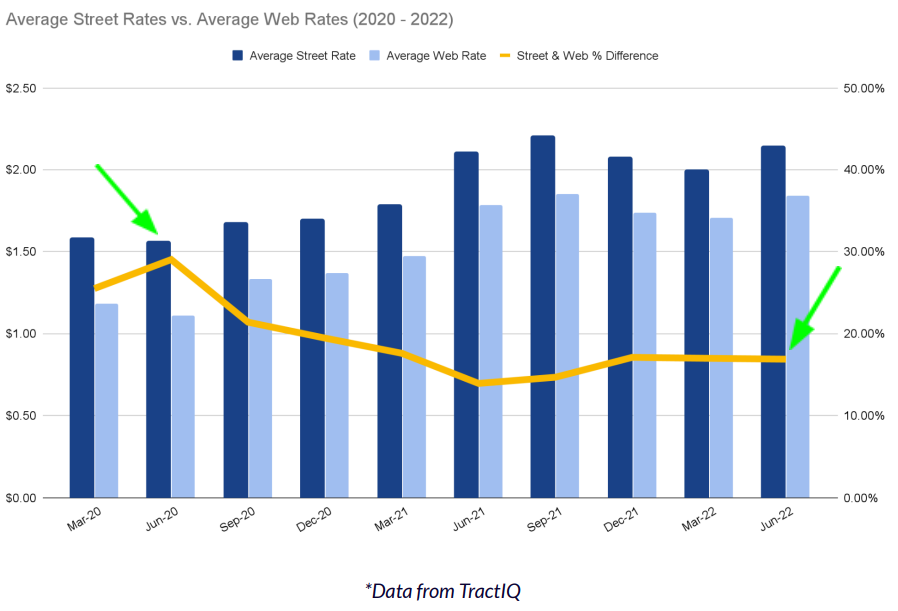
The above graph shows data for a time period when self-storage demand increased to unprecedented levels (2020-2022).
To emphasize just how strong self-storage demand was at the time, Public Storage reported a same-store portfolio occupancy of 97.0% in Q2 2021. This occupancy figure is the highest occupancy ever reported for Public Storage since information became available in 2002. Street rates also increased from $1.56 in June 2020 to $2.20 in September 2021, a 41% increase.
The massive increase in demand was driven primarily by the COVID pandemic. During this time, people relocated from populous city centers to suburban areas. Interest rates were also extremely low, making it more affordable to change residences. The Federal Funds Effective Rate was 0.08%, and the 30-year fixed mortgage rate was 3.01% by the end of September 2021.
According to the SSA 2023 Self Storage Demand Study, moving is a major demand driver for self-storage. 35% of renters from the study who have short-term rental needs indicated they use storage because they are moving. As a result of lower interest rates and migration from city centers during COVID, demand for self-storage significantly increased.
Evidence of this can be seen in the graph above. You can see discounting started to decrease in late 2020 (yellow line). Because demand was high, operators gained more pricing power and did not have to discount web rates as much to attract customers.
Within the timeline of the graph above, operators seized the opportunity by raising street rates ~35% and reducing discounting to ~15% at the peak, down from ~30% shown in June 2020. In the second quarter of 2021, demand topped out and discounting dropped to an average of ~15% for the quarter which fueled a large increase in self-storage transaction activity.
Sales volume for self-storage increased by 267% from ~$6.5 billion in 2019 to $23.9 billion in 2021, according to RCA. Sales volume decreased to $14 billion in 2022, but still ~66% above 2020’s volume. As evidenced by the increase in transaction activity, investors were bullish on the self-storage industry with seemingly no end in sight to demand.
2022 to 2024: Softening Storage Demand Since 2022 Increased Discounting by 120%
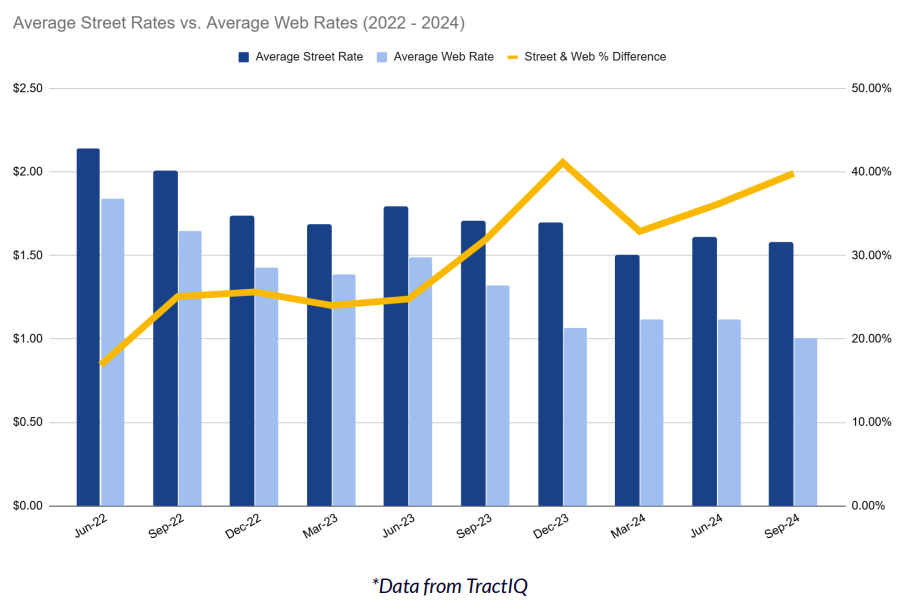
The period from 2022 until the end of 2024, as shown in the graph above, has been challenging for the self-storage industry for mainly two reasons.
- Increasing interest rates and falling home sales
- Oversupply, due to a development lag
Because the market was so “hot” from 2020 to 2022, developers were justified in building more self-storage due to high demand. According to the U.S. Census Bureau, self-storage construction spending of $6.9 billion in 2023 marked a 24% increase over 2022.
While 2023 marked a record year for self-storage construction spending, self-storage demand peaked in 2021. This suggests that developers and operators were late to capitalize on the overwhelming demand as they likely planned and entitled projects in 2021/2022, with construction starting in 2023. This is an unfortunate lag in timing as newly built self-storage projects began to deliver in 2023 during a time of decreasing demand.
The construction lag further highlights how pricing and discounting are, perhaps, better ways to capitalize on fickle market fluctuations. It also suggests the importance for developers to signal entry into a market. This may cause other developers to think twice before building additional storage, creating more competition.
Oversupply creates more competition between operators and shifts pricing power to the customer. In Q3 2024, the difference between street rates and web rates was ~40% (yellow line). This level of discounting even exceeds early-COVID levels, which was ~30% at its peak. Softening demand led to slower lease ups, resulting in operators being more aggressive on pricing to attract customers.
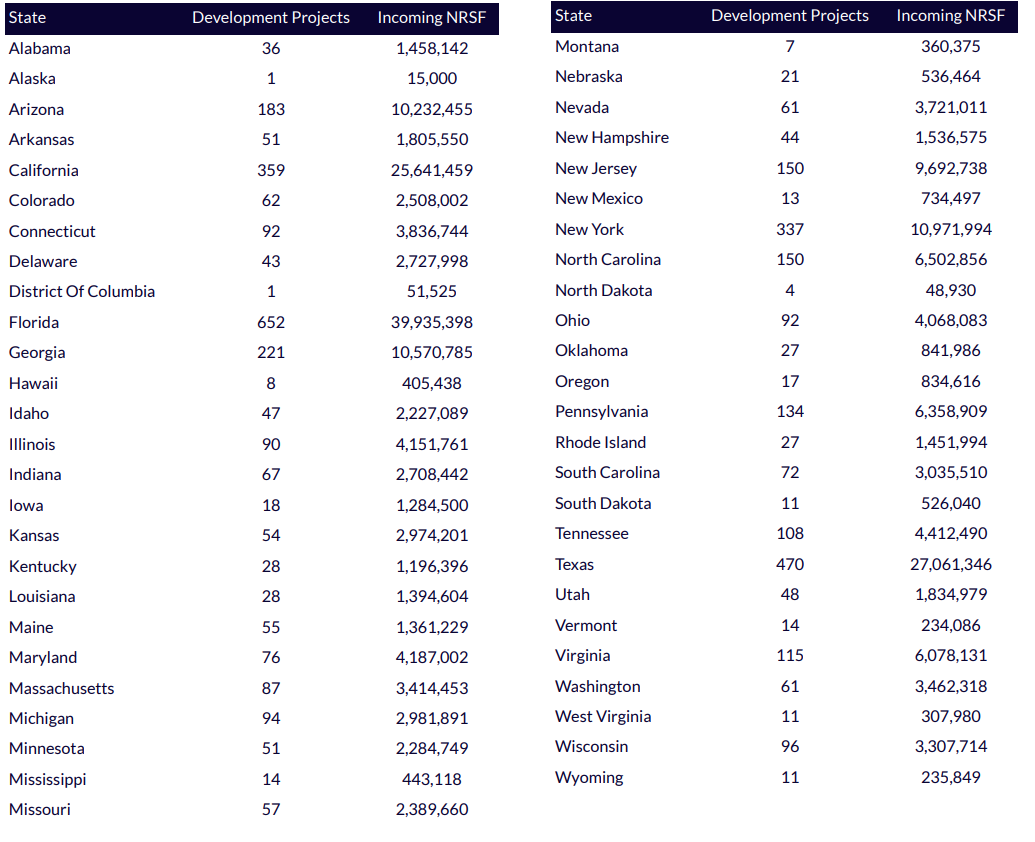
TractIQ currently tracks over 4,400 self-storage sites under development and provides data on:
- Projected gross and net rentable square feet to be delivered
- Project details and project logs including dates and stages of construction (concept, planning, under construction, etc.)
- Developer contact information
The data on the next page from TractIQ shows the number of self-storage development projects and incoming net rentable square feet by state across the nation.
Macro Policy Decisions Directly Influence Self-Storage Operations
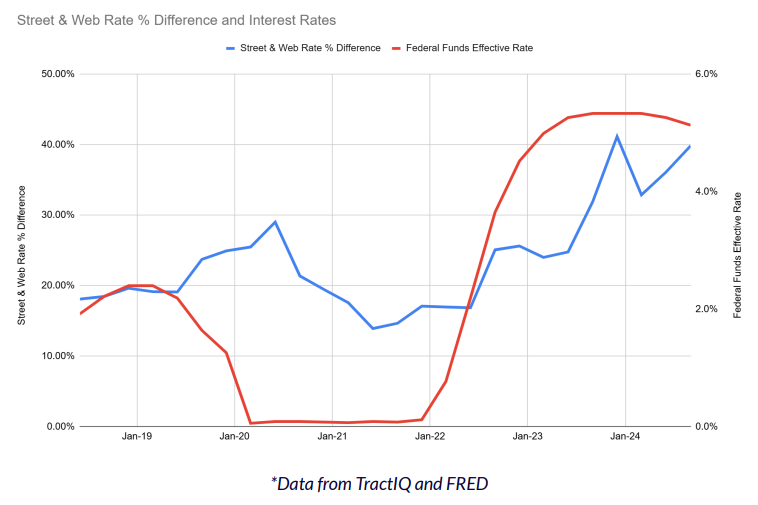
The above graph overlays the Federal Funds Effective Rate against the percent difference in street and web rates. The correlation between these metrics is positive and discounting tends to lag behind interest rates.
For example, as a result of the Federal Funds Effective Rate being near 0% from 2020 to 2022, too much storage supply became an issue as developers took advantage of cheaper financing. Higher discounting soon followed as operators worked through the oversupply over the next two years.
Storage demand is also significantly impacted by changes in interest rates. Increasing rates puts pressure on the consumer’s discretionary spending and also makes changing residences, a major demand driver for self-storage, more expensive.
Why purchase a new home with a mortgage at a 6% interest rate when you could stay in your current home at a 3% interest rate? This has caused a major slowdown in the residential housing market.
In fact, existing home sales dipped to a 14-year low in September of 2024. When people aren’t moving, self-storage demand suffers.
REITs Drive the Discounting Strategy in Self-Storage
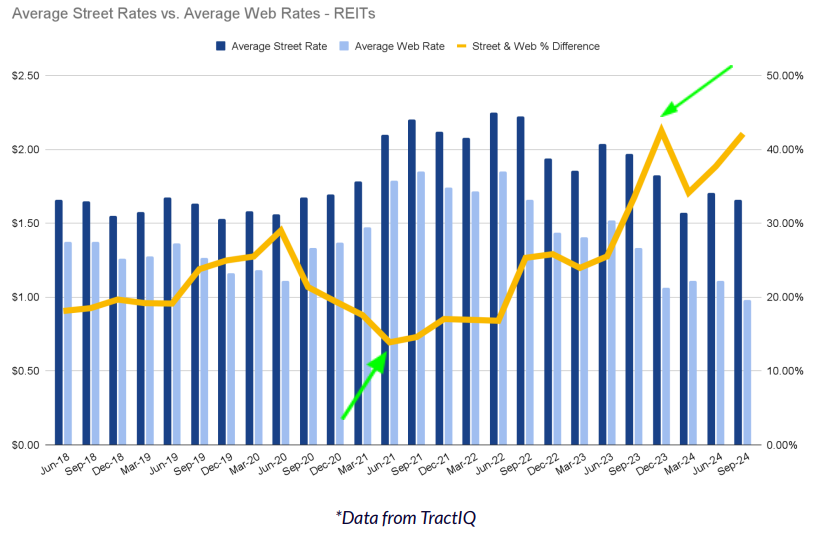
The graph above shows street rates, web rates, and the average difference of those rates for just the self-storage REITs (Extra Space, CubeSmart, Public Storage, NSA). You will notice from the green arrows in the REIT graph above that the minimum value of the street/web rate % difference is ~15% while the maximum value is ~42%. This is a wide spread and shows that as demand decreases, REITs compete for customers by aggressively discounting and offering the most competitive prices (web rates). REITs can afford this strategy for a few reasons.
- REITs have robust revenue management teams and change web and street rates quickly using complex algorithms.
- REITs have a volume advantage. The cost of a single customer, or several customers, defecting from a single store is low if and when their models “get it wrong”. REITs can also afford to capture an entire submarket by lowering rates more than their competitors to increase occupancy. Regional operators or owners of single stores may not have this margin of safety.
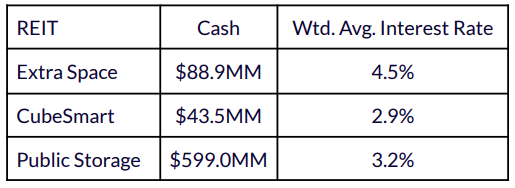
- REITs have large cash reserves and the lowest cost of capital. The table below shows cash balances and weighted average interest rates on all debt for the REITs as of September 30th, 2024. The REIT interest rates are 200+ bps better than what the market currently offers, depending on the risk of the project. This allows the REITs to withstand macro pressures and sustain discounted pricing longer than smaller operators.
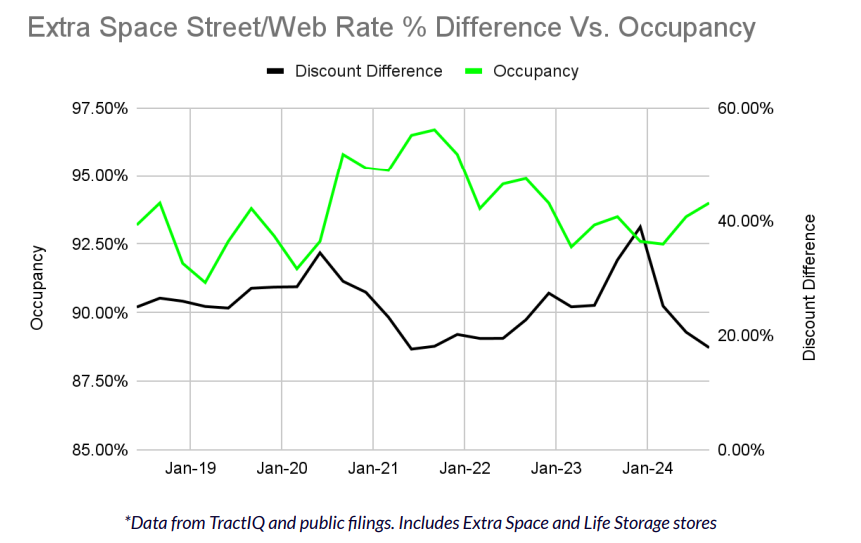
Extra Space’s Discounting Strategy Reveals a Larger Focus On Occupancy Compared to Other REITs
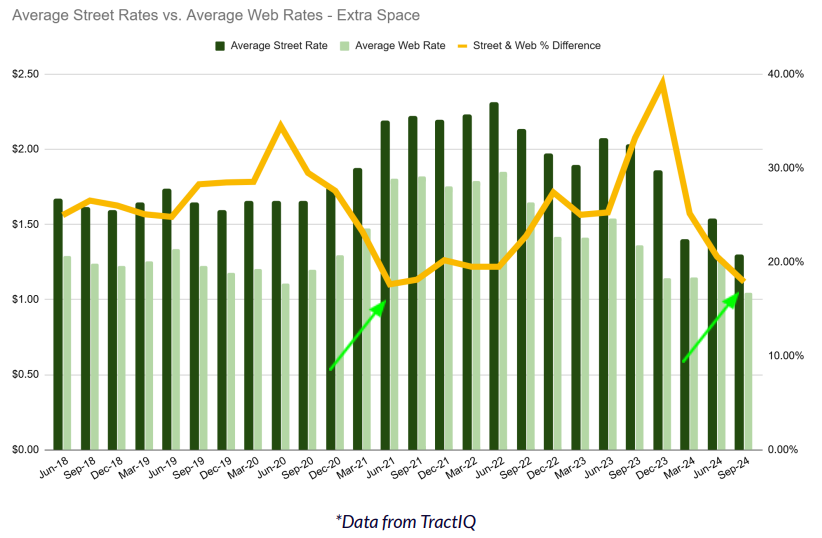
As shown in the graph above with the green arrows, the difference between Extra Space’s street rates and web rates (yellow line) at the end of 2024 is nearly the same level as it was in 2021, when demand for self-storage was the highest.
Why is the difference in rates for 2021 and 2024 similar when demand was vastly different?
You will notice that the actual rates in 2024 compared to those in 2021 are also vastly different. The table below shows Extra Space street and web rates in 2021 compared to those in 2024. Interestingly, Extra Space is currently dropping both street rates and web rates to capture any demand within a challenging market.
|
Extra Space |
2021 |
2024 |
% Discount |
|
Street Rate |
~$2.20 |
~$1.25 |
43% |
|
Web Rate |
~$1.80 |
~$1.00 |
44% |
In recent earnings calls, Extra Space expressed that they are hyper-focused on maintaining high occupancy. This strategy is confirmed by the data above and shows that Extra Space is willing to decrease their initial move-in revenue to prop up occupancy. Extra Space wants customers in the door, even if it would mean dropping street and web rates to very low levels.
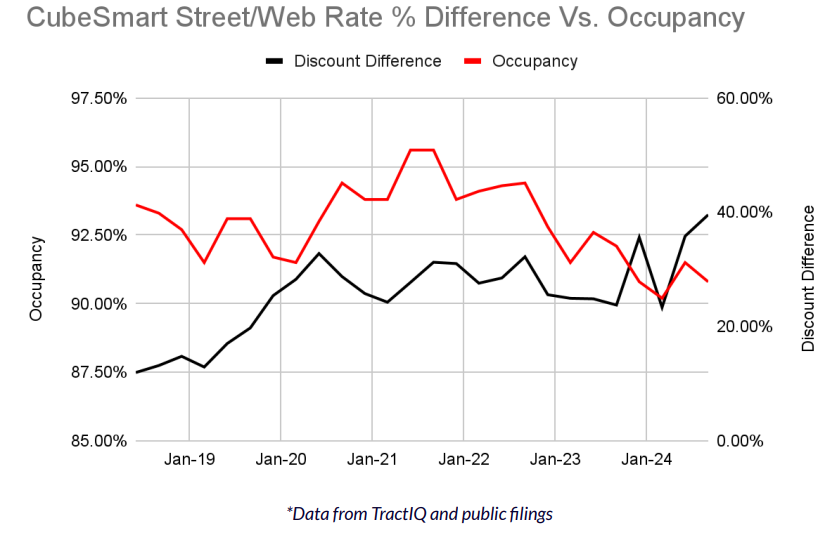
CubeSmart’s Discounting Strategy Reveals a Balance Between Revenue and Occupancy Compared to Other REITs
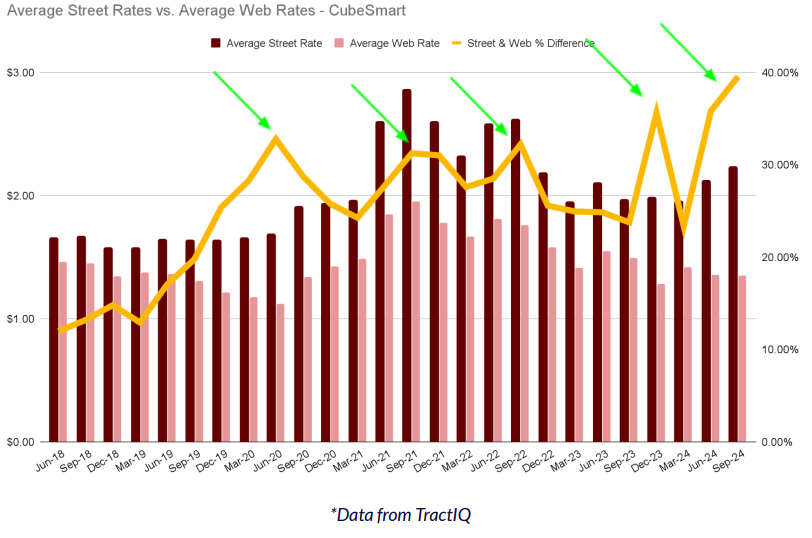
As shown in the graph above, CubeSmart has maintained remarkably high discounts in recent history. The difference between street and web rates has crested over 30% five times in the last 5 years compared to Extra Space, where it has happened only twice, and Public Storage, where it has happened only once.
Interestingly, CubeSmart has held street rates and web rates relatively steady in recent history. Compared to Extra Space and Public Storage, CubeSmart appears to be the most consistent in their pricing strategy.
Recently, however, CubeSmart’s web rates have slightly decreased, while street rates have increased, creating a wide spread of nearly 40% between the two. Perhaps this is CubeSmart’s way of trying to maintain higher revenue from move-ins while also trying to attract new customers online during a time of low self-storage demand.
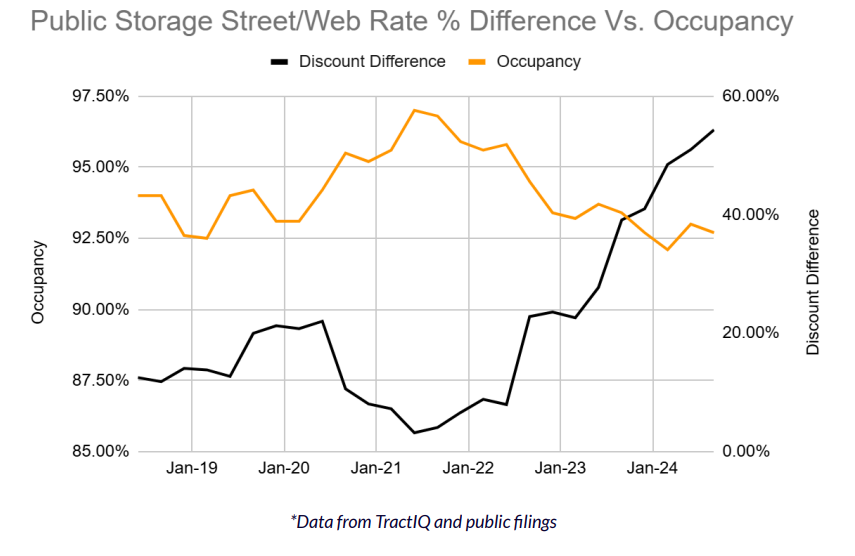
Public Storage’s Discounting Increased 10x Since June 2021
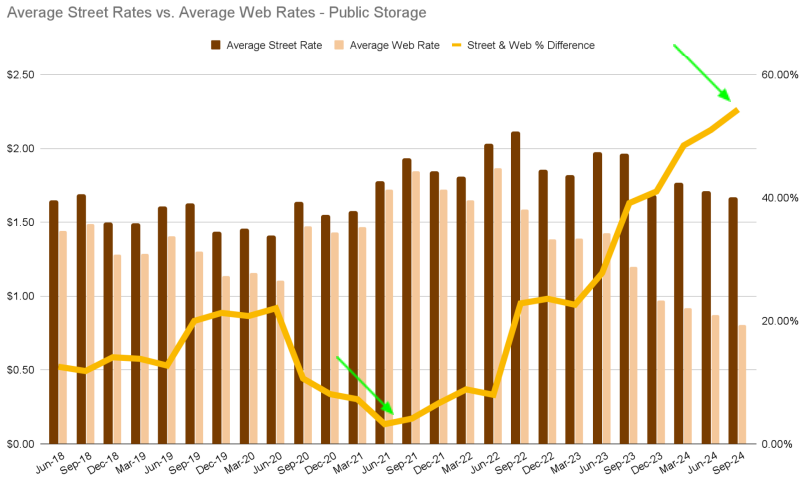
Public Storage has been the most aggressive in discounting their web rates to street rates over the last year. As of Q3 2024, the street/web rate difference is ~55%, the highest out of all the REITs currently and in recent history.
This is in contrast to the summer of 2021 when Public’s street rates and web rates were nearly identical and self-storage demand was at its peak.
Public Storage has held street rates mostly steady over the last year, but their web rates have decreased significantly and are ~$0.75 as of the end of 2024. This is far below Extra Space and CubeSmart, whose web rates are above $1.00 as of the end of 2024. This data suggests that Public Storage is determined to win the pricing battle for new online customers.
How the REITs Compare to Each Other
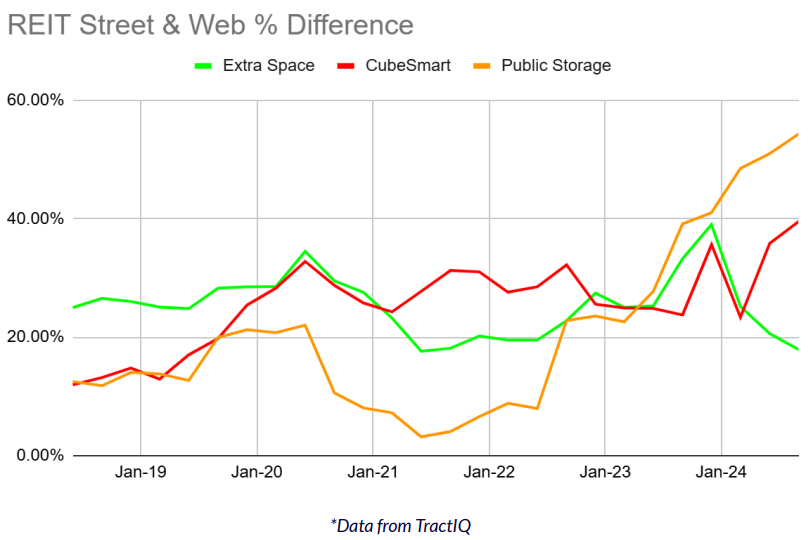
To summarize the REITs, the above graph takes the yellow discounting line in each of the previous three REIT graphs and compares them. Even though Extra Space, CubeSmart, and Public Storage operate in the same business, it is interesting to see how their pricing strategies differ in recent history and where they are today. Based on the data in the previous three sections, each REIT’s strategy can be summarized below.
- Extra Space is heavily focused on maintaining high occupancy and is willing to sacrifice initial move-in revenue to achieve this. They are currently dropping both street and web rates to prop up occupancy.
- CubeSmart is performing a balancing act of capturing higher move-in revenue by increasing street rates and attracting new online customers by decreasing web rates.
- Public Storage has not changed street rates too drastically recently to keep move-in revenue steady, but they are determined to win the pricing battle for new online customers by decreasing web rates drastically.
Discounting Strategies for Non-REIT Operators
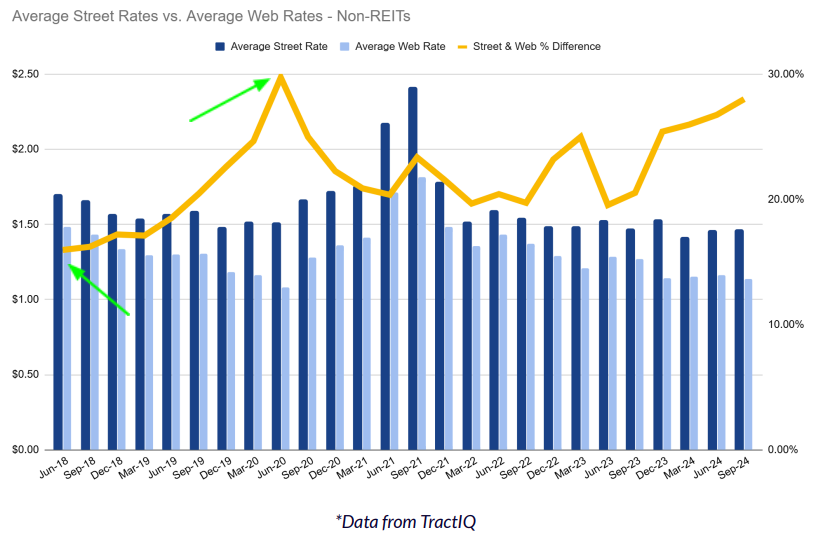
The analysis above shows street rates, web rates, and the average difference of those rates for only non-REIT operators. As shown by the green arrows above, the minimum value of the street/web rate % difference is ~18% while the maximum value is ~30% (1200 bps) – less than half of the REIT spread (2700 bps).
Most non-REIT operators do not have the algorithms and revenue management teams that the REITs do, so they do not change prices as often nor as aggressively. In addition, non-REIT operators tend to have facilities located in more suburban or rural areas as opposed to REIT operators. Operators with facilities in rural areas may be less likely to implement aggressive price changes because it would be more challenging to replace a customer if they leave.
Facilities located in denser areas can replace customers more easily because they have a greater population to draw from. This provides the operator more leeway to experiment with frequency and magnitude of price changes.
Despite all of this, non-REIT operators do respond over time, with a steadily increasing discount rate from ~18% to ~30% leading up to COVID and a similar run up during the post-COVID market weakness.
Conclusion
How Discounting Correlates to Occupancy
It is no secret that the self-storage industry has faced significant headwinds since 2023. Inflation and rising interest rates have put pressure on the consumer and dampened residential migration, decreasing self-storage demand. These pressures have significantly decreased transaction and investment activity within the self-storage industry.
How do self-storage operators respond when demand dries up and the future is uncertain? They aggressively discount rental rates to attract whatever customers remain.
REITs are more willing to experiment with rates and discounting to attract more customers. Each REIT seems to be focused on different strategies that have changed and evolved over time. So which strategy is winning?
Unfortunately, a “winning” strategy has not emerged.
According to TractIQ’s Q3 2024 Storage REIT Report, every REIT has experienced a decrease in revenue and NOI growth over the last year, and their stocks are down ~5.6% on average year-over-year. When there is simply a lack of demand in the market for self-storage, revenue and NOI growth will be negatively affected, no matter how heavily rates are discounted.
The three graphs below show the discounting difference for each REIT compared to occupancy over time.
In the graphs, occupancy is used as an indicator of storage demand. However, occupancy is only one factor out of many that can indicate storage demand within a market. You will notice an inverse relationship between the discounting difference and occupancy. As discounting increases, occupancy (demand) decreases, and vice versa.
If we take a step back, what story does all of this data tell us?
- A wide spread between street and web rates typically signals less self-storage demand in the market because operators are competing more for customers by discounting web rates
- A tight spread between street and web rates typically signals more self-storage demand in the market because operators don’t need to discount web rates as much when more customers are renting storage
- REITs are major drivers for rate discounting trends with non-REIT operators typically following the same trends in less aggressive ways
Demand for self-storage will always fluctuate based on a variety of factors. Paying attention to street and web rates provides valuable insights as we all look to make smarter, data-driven investment decisions in 2025 and beyond.