
ARCO/Murray Construction Data Release
TractIQ and ARCO/Murray have partnered to release 18M SF of self-storage construction data that covers 100+ self-storage projects built by ARCO/Murray across 27 states, including gross and net rentable area, building form, schedule, and hard cost from 2016 through 2026.
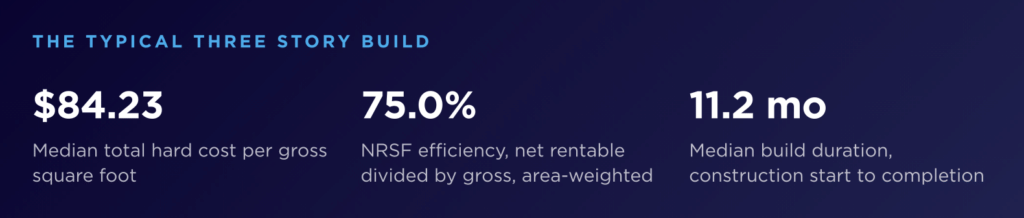
THE TYPICAL THREE STORY BUILD
Self-storage has never had a construction cost benchmark it could check. Developers price projects against a broker’s number, a contractor’s estimate, or whatever their last build happened to come in at. None of it is verifiable, none of it is comparable, and all of it is someone’s recollection. Today that changes: ARCO/Murray is contributing more than a decade of its own completed project data to the industry totaling 18M SF, and TractIQ is publishing it as a reference point the industry can check its early numbers against.
THE NUMBER NOBODY COULD ACTUALLY CHECK
Every other input to a storage pro forma has a market source. Rents, occupancy, cap rates and supply pipelines are all tracked, published, and argued over. Construction cost, the single largest line in a ground-up deal, has not been. It lives in the files of the firms that do the building, and those firms have had every commercial reason to keep it there.
So the industry improvised. A developer asks three contractors and averages them. An investor takes replacement cost on faith because there is nothing to check it against. A lender hears a number and has no independent basis to test whether it is conservative or optimistic. Everyone has been working from anecdote and calling it a benchmark.
WHAT THAT HAS COST DEVELOPERS
Three things go wrong when cost data is anecdotal. The first is the sanity check: without a distribution you cannot tell whether a number you have been handed sits in the normal range or well outside it, and a project that prices 20% above the market looks identical to one that prices at it. The second is escalation. Costs moved hard between 2021 and 2024, and almost nobody could separate real escalation from a change in what they happened to be building.
The third is the one that does the most damage. A single blended median across every building type is close to useless. A five-story climate-controlled build with a basement and a low-rise drive-up project are different products with different costs, and averaging them produces a headline number that describes neither. Quoted without that context, it makes ordinary projects look expensive and expensive projects look ordinary.
WHAT ARCO/MURRAY IS CONTRIBUTING
The release covers 100+ completed self-storage projects delivered by ARCO/Murray across 27 states between 2016 and 2026. For each one it carries gross and net rentable area, building form, above-grade stories and below-grade floors, site acreage, construction start and completion dates, and total hard cost split into vertical construction and sitework.
What that supports is the first pass. These are market reference points rather than estimates, built for sizing a pro forma before there are drawings, sanity checking a cost a broker or a seller has quoted, and testing replacement cost on an acquisition. For that work, a median drawn from 100+ completed builds beats a number somebody half remembers. What it will not do is price your deal. Soils, topography, utilities, jurisdiction, unit mix, finish level and labor all move hard cost more than any median can capture, and no two sites price the same way.
WHAT THE DATA SHOWS
Three story median hard cost rose about 47% between the 2021 and 2024 delivery years, tracking the material and labor shock the whole construction sector absorbed.
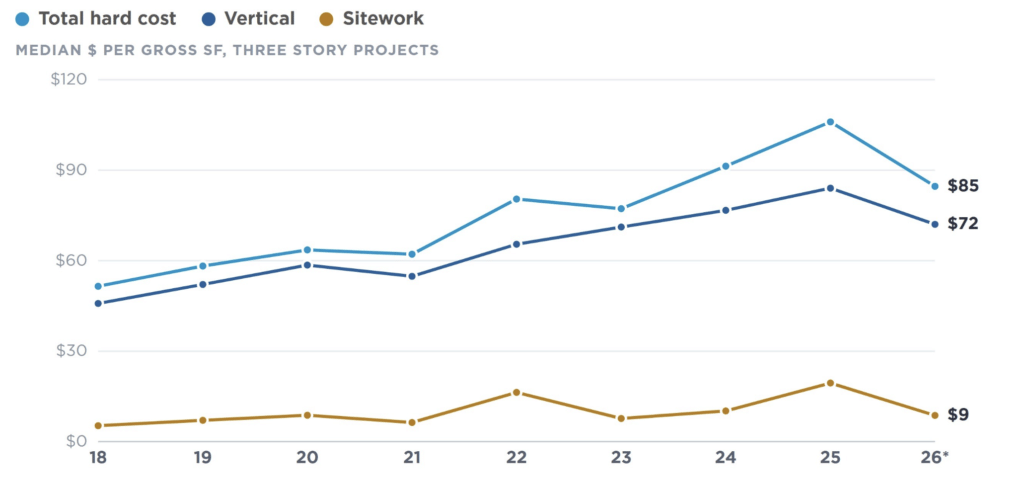
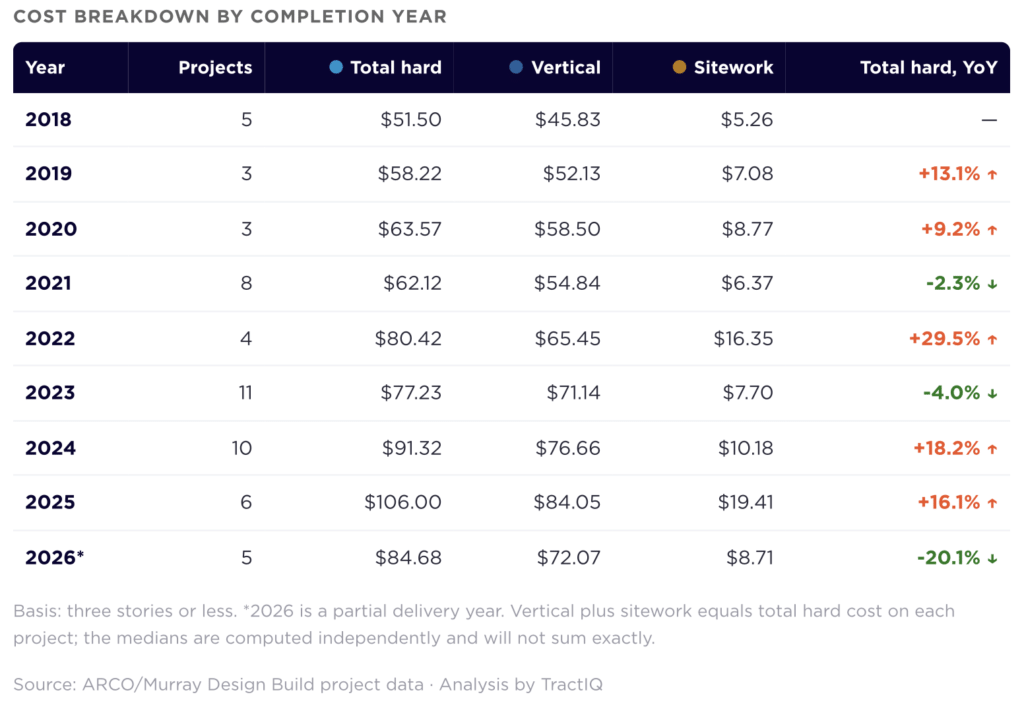
Splitting hard cost into its components changes the picture entirely. Across the full data set, vertical construction cost rose about 28% between 2021 and 2025. Over the same four years sitework rose about 93%. Sitework escalated more than three times as fast as the building it supports.
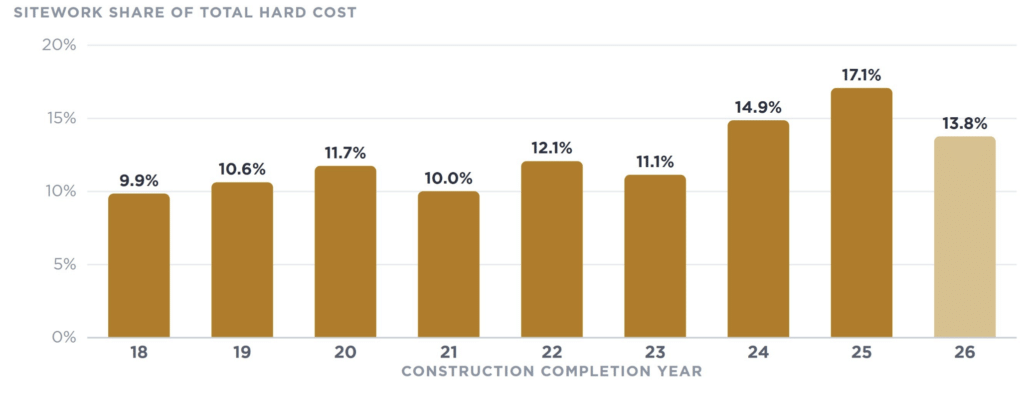
As a share of the budget that shift is plain: sitework ran 10.0% of total hard cost in 2021 and 17.1% in 2025. On a $10 million build, roughly $700,000 moved out of the building and into the ground underneath it.
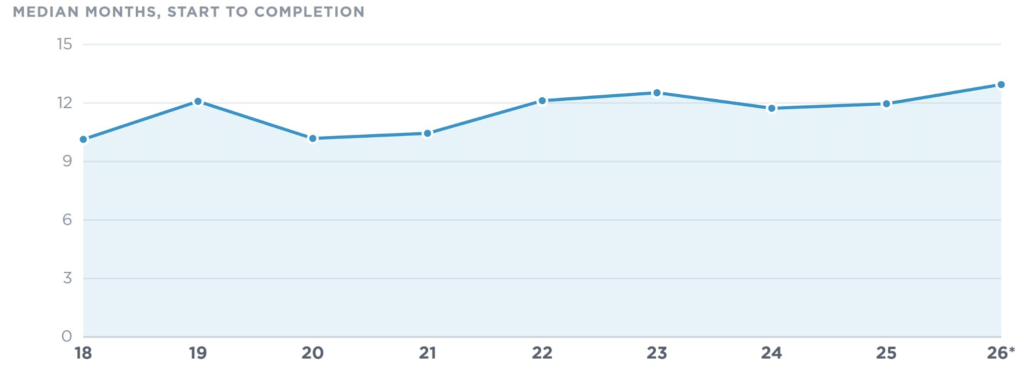
Schedules tell the third story. Median construction duration is 11.6 months start to completion, with half of builds finishing between 10.0 and 12.8 months. Builds completing from 2018 through 2021 ran a median of 10.6 months; those completing since run 12.2. About a month and a half has been added to the typical build, and unlike cost it has not come back.
Read all of it as direction rather than as a quote for your own project. It is enough to tell you whether you are in the right neighborhood on cost and schedule, which is what an early pro forma needs. Once a deal is real, get a builder involved as soon as possible. The only number worth underwriting to is one built for your site, your drawings and today’s prices.
“Construction cost has been unavailable at scale for self-storage underwriting. We owe Eric and the ARCO/Murray team real credit. They have completed hundreds of projects representing billions in hard costs, and instead of keeping that as a competitive edge, they are opening it to the industry. It means a developer can budget against what building actually costs, and an investor can finally check replacement cost against something real.”
— Noah Starr, Chief Executive Officer, TractIQ
“We’re thrilled to be partnering with Noah’s team at TractIQ to give something back to the industry that has been so good to us. We hope the data is useful and helps owners, brokers, capital providers and developers with quick gut check underwriting. I’d be remiss if I didn’t say that we have never built the same building twice, and building type and size can vary costs wildly, so only rely on the data for an initial smell check, then get your builder (hopefully ARCO!) involved right away as you move a development forward.”
— Eric Fleps, President, ARCO/Murray
Get the Data
TractIQ customers
The full data set is live in the TractIQ Interactive Data Hub, filterable by state, delivery type, project status, building form, and cost basis, alongside the rest of the TractIQ storage data.
In the coming months the ARCO/Murray data will be fully integrated into TractIQ’s facility data, accessible directly within the platform.
Open the Interactive Data Hub →
Not A Customer Yet?
A four-page benchmark handout carrying the national figures, covering cost per square foot, building form, schedule and land efficiency, is free to download with no account required.
Frequently asked questions
How much does it cost to build a self-storage facility per square foot?
Across the ARCO/Murray data set, a typical class A building of three stories or less runs a median total hard cost of $84.23 per gross square foot. Treat that as an early pro forma check or a replacement cost reference rather than an estimate for a specific project.
Can I use this data to budget a specific project?
Use it for the first pass, not the final number. It is well suited to sizing an early pro forma, checking a cost a broker or a seller has quoted, and testing replacement cost on an acquisition.
It is not a substitute for pricing your own deal: site conditions, unit mix, finish level and the local labor market move hard cost more than any median can capture. Once a deal is real, get a builder involved as soon as possible.
Are self-storage construction costs still rising?
Escalation through 2024 is well documented: median hard cost for projects with three stories or less rose about 47% between the 2021 and 2024 delivery years.
How long does it take to build a self-storage facility?
Median construction duration is 11.6 months from construction start to construction completion across all projects in the data set. Half finish between 10.0 and 12.8 months, and 90% finish inside 13.5 months.
Schedules have lengthened by roughly 15% since 2021 and, unlike cost, have not come back.
How much of a self-storage construction budget is sitework?
Sitework was 17.1% of total hard cost for builds completing in 2025, up from 10.0% in 2021. Across the same span sitework cost per gross square foot rose about 93% while vertical construction cost rose about 28%, so sitework escalated more than three times as fast as the building it supports.
What percentage of a self-storage building is rentable?
Area-weighted NRSF efficiency is 75.0% across the three stories or less data set. The 25% that is not rentable is circulation, elevators, stairs, offices, restrooms, mechanical space, and exterior wall thickness.
