DOWNLOAD · Q1 2026 REIT REPORT

Self-storage REITs just posted their strongest quarter in two years.

Every public self-storage REIT posted positive or flat same-store revenue in Q1 2026 — the first time that’s happened since 2024. Occupancy held steady, move-ins picked up, and Public Storage announced a $10.5B merger with NSA. Here’s the full breakdown.

Free Download

Every REIT told a different Q1 2026 story. Here's what happens when you line them up.

PSA came in flat. NSA turned positive. CubeSmart broke a six-quarter losing streak. On their own, each of those is just one data point from one earnings call. Put side by side, they show something bigger happening across the sector this quarter. That’s what this report does: REIT by REIT, market by market.

+1.7% / +1.5%

Same-Store Revenue Growth

First quarter since 2024 with every REIT at 0% or better.

90.9%

Weighted Avg. Occupancy

Down just 0.2 pp YoY. Looks like a floor, not a slide.

+25.0%

Achieved Rate Premium Over Street

Up from +19.2% in Q1 2025.

KEY INSIGHTS

The six things that stood out this quarter

Revenue is positive across the board

Every public REIT posted flat or positive same-store revenue for the first time since 2024. EXR led at +1.7%; CubeSmart broke a six-quarter losing streak at +0.6%.

NOI mostly kept pace

EXR, NSA, SmartStop, and PSA all posted positive same-store NOI growth. CubeSmart was the one exception, weighed down by a 54% jump in advertising spend.

Occupancy looks like it's bottomed out

Sector-wide occupancy held at 90.9%, down just 0.2 pp YoY. EXR (93.0%) and SmartStop (92.3%) are ahead of the pack.

Move-ins picked back up

EXR's net move-ins jumped 58% YoY. CubeSmart posted its strongest move-in volume since Q1 2023, usually a sign revenue follows.

Public Storage is buying NSA

A ~$10.5B all-stock deal would add 1,000+ NSA stores to PSA's platform. Closing is expected Q3 2026.

Achieved rent is pulling further away from street rate

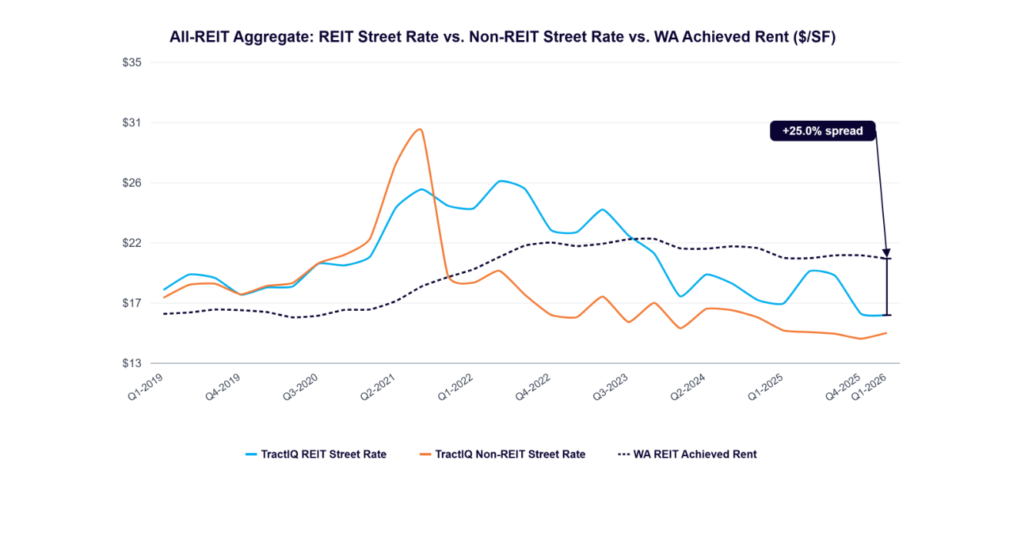
$20.66/SF achieved vs. $16.52/SF street, a gap that was +19.2% a year ago. Sunbelt markets are the main drag.

THE DATA

See the data behind the headline.

Street rate vs. achieved rent — all REITs

Q1 2026 self-storage REIT street rate vs. achieved rent chart — all REITs, ~25% street-to-achieved spread

The +25% gap between street and achieved rent is easier to see charted out than described in a sentence.

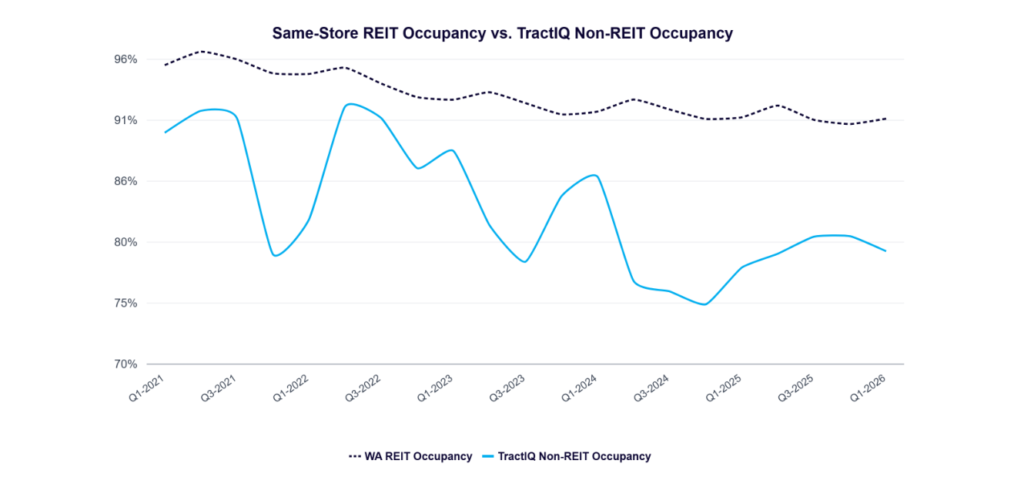
REIT vs. non-REIT occupancy

Q1 2026 self-storage REIT vs. non-REIT same-store occupancy chart

Same-store REIT occupancy is sitting above the broader non-REIT market this quarter.

WHAT'S INSIDE

What's inside the free report

REIT-by-REIT scorecards

Revenue, NOI, occupancy, and move-ins for every public self-storage REIT.

MSA-level rate and occupancy detail

Street rate, achieved rate, and occupancy broken out by market.

Quarter-over-quarter trend charts

The same charts shown above, broken out REIT by REIT.

FREE DOWNLOAD

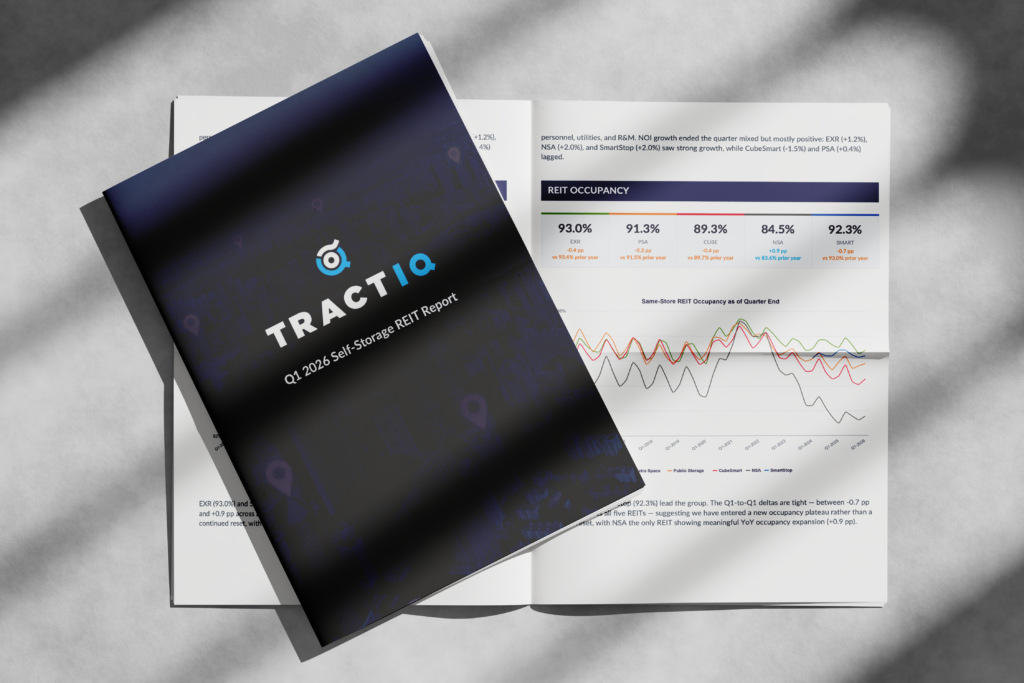
Free Q1 2026 REIT Performance Report

FAQ

Self-storage REIT data, answered

It’s revenue growth measured only across facilities a REIT has owned and operated for a full comparable period, so new acquisitions don’t skew the number. In Q1 2026, every public self-storage REIT hit 0% or better for the first time since 2024.
Extra Space Storage (EXR), Public Storage (PSA), CubeSmart, National Storage Affiliates (NSA), and SmartStop.
On March 16, 2026, Public Storage announced a roughly $10.5B all-stock merger with NSA. It would add 1,000+ NSA wholly-owned stores to PSA’s 3,000+ store platform, with closing expected in Q3 2026.
Street rate is what’s advertised to a new customer walking in the door. Achieved rate is what the REIT is actually collecting across its whole portfolio, existing tenants included. That gap widened to +25% this quarter — $20.66/SF achieved against $16.52/SF street.
Quarterly, right after each round of public REIT earnings.
Yes. Fill out the form on this page and it’s yours.

Industry Leaders Who
Trust TractIQ

Why Q1 2026 is a turning point for self-storage REITs

For most of the last two years, self-storage REIT earnings have been a mixed bag — one operator up, another down, occupancy sliding somewhere in the background. Q1 2026 broke that pattern. All five publicly traded self-storage REITs posted same-store revenue growth of 0% or better, the first time that’s happened since 2024. That alone is worth paying attention to, but the story underneath the headline number is more interesting than the number itself.

Same-store revenue and NOI, REIT by REIT

Extra Space Storage led the group at +1.7% same-store revenue growth, with SmartStop close behind at +1.5%. CubeSmart came in at +0.6%, which doesn’t sound like much until you know it ended six straight quarters of negative revenue growth. Public Storage was flat at 0.0%, and NSA returned to positive territory at +0.2%.

NOI mostly tracked revenue. EXR, NSA, SmartStop, and PSA all posted positive same-store NOI growth. CubeSmart was the outlier at -1.5%, and the reason is specific: advertising expense jumped 54% year over year, and personnel costs rose 7.2%. Revenue can turn positive while NOI still lags if a REIT is spending harder to get there.

Occupancy and move-in volumes

Sector-wide weighted average same-store occupancy landed at 90.9% in Q1 2026, down just 0.2 pp year over year and about 5.1 pp below the 2021 peak. That’s a small enough move to read as stabilization rather than a continued slide. EXR (93.0%) and SmartStop (92.3%) are running ahead of the group, and NSA was the only REIT to post occupancy expansion, up 0.9 pp YoY.

Move-in volumes back that up. EXR’s net move-ins jumped 58% YoY to 6,375, its strongest quarter since Q1 2024. CubeSmart posted 1,903 net move-ins, its highest volume since Q1 2023 and its largest year-over-year gain since 2021. EXR’s move-in rate turned positive year over year for the first time on record, and even PSA’s move-in rate decline, at -2.4%, was its smallest since the data series started in 2020. Move-ins tend to lead revenue by a quarter or two, so this is one of the more useful numbers in the whole report.

Want the full REIT breakdown for the markets you underwrite?
Get the free REIT report

The Public Storage-NSA merger

The other headline from the quarter: on March 16, 2026, Public Storage announced an all-stock merger with National Storage Affiliates worth roughly $10.5 billion. It would fold 1,000+ NSA wholly-owned stores into PSA’s existing 3,000+ store platform, and it pushes PSA deeper into secondary and tertiary markets where NSA already has a footprint. Closing is expected in Q3 2026. If it goes through, it’s one of the larger consolidation moves the sector has seen, and it’ll be worth watching how it changes PSA’s exposure outside the top MSAs.

Reading the achieved-rate vs. street-rate gap

One number that’s easy to miss in the earnings decks: the gap between what REITs are actually collecting (achieved rate) and what they’re advertising to new customers (street rate) widened again this quarter. REIT weighted-average achieved rent hit $20.66/SF against a TractIQ-tracked street rate of $16.52/SF, a $4.14/SF spread, up from +19.2% a year ago to +25.0% now. That’s not uniform across markets. Sunbelt metros like Austin, San Antonio, and Dallas are still showing street rate weakness, while supply-constrained markets like Los Angeles, Minneapolis, and San Jose posted positive year-over-year growth. If you’re underwriting a deal, which side of that split your market falls on matters more than the sector average.

The full report breaks all of this down REIT by REIT and MSA by MSA — get it here. For more on how street and achieved rates diverge across markets, see our self-storage REIT source data page, or check self-storage market data for the broader picture. If you want to talk through what this means for a specific deal, book a demo.

Get the full Q1 2026 REIT report

Same-store revenue, NOI, occupancy, and rate data for every public self-storage REIT. Free.

Free Q1 2026 Self-Storage REIT Report
Same-store revenue, occupancy & rate data for every public REIT
Get the free report