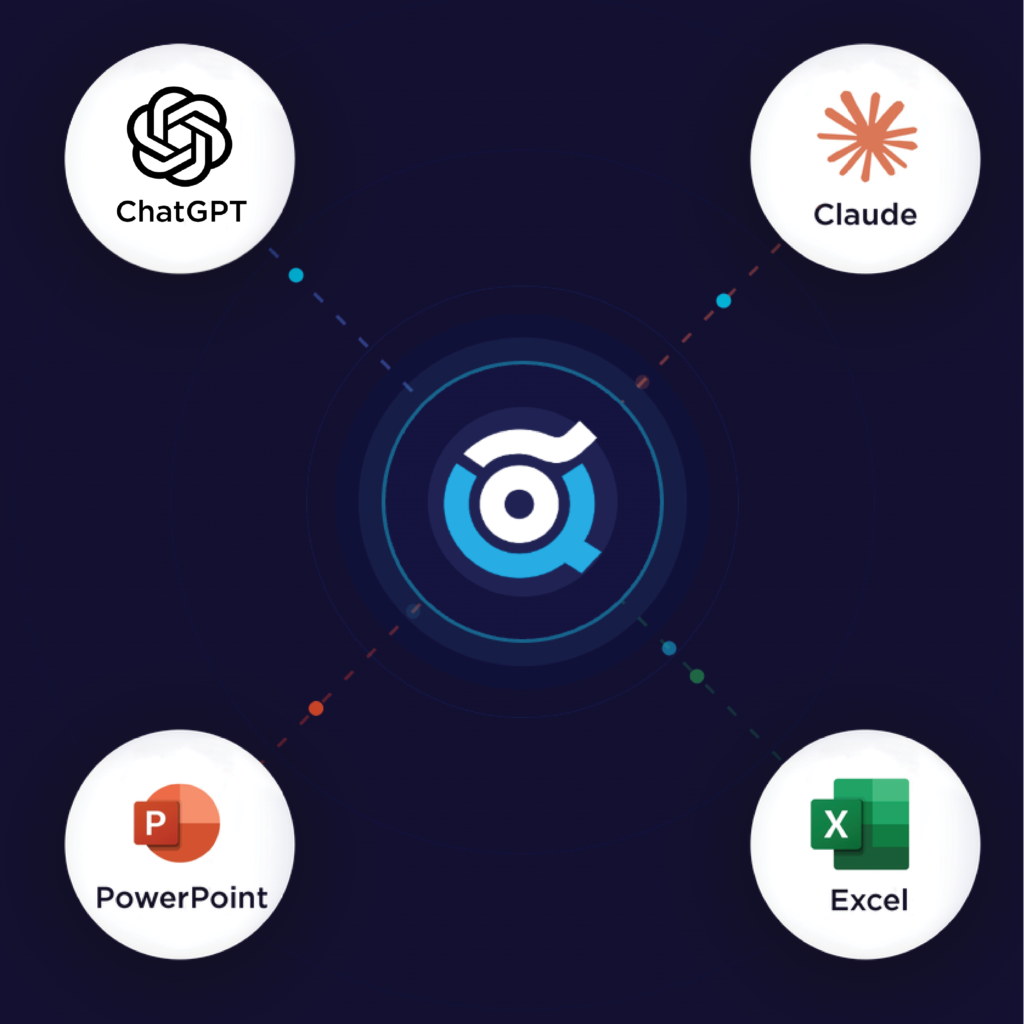
TractIQ analyzed four trade areas for Meridian Capital Group: Austin, TX; Nashville, TN; Phoenix, AZ; and Charlotte, NC. The 5-mile rings around each anchor present four meaningfully different storage markets. Austin is supply-constrained with strong occupancy (avg 91.2%) despite a 14% rate correction from 2022 peaks — the demand fundamentals remain intact. Nashville is the highest-growth market with population up 6.2% since 2020 and zero CMBS-tracked pipeline within 3 miles of the anchor. Phoenix shows the broadest margin compression (avg −6.8pp from 2022 peak) as new supply delivered into a softening demand environment. Charlotte is the most fragmented market, split 52/48 between institutional and independent operators, with the most resilient NOI margins in the set. Across all four, current web rates sit ~18% below street rates — indicating operators are using online concessions to sustain occupancy. Details by section follow.
4
Anchor Markets Analyzed
74
CMBS Facilities Tracked
89.4%
Portfolio Avg Occupancy
TractIQ · Meridian Capital Brief
1. Anchor Footprint & Demographics
Each figure in this memo is built from the 5-mile trade area surrounding the anchor sites listed below. Demographics are pulled from block-group data intersecting the 5-mile ring, population-weighted for median household income.
Anchor
Submarket
5-mi Pop
Med HH Inc
% Renter
Pop Growth
Austin
South Congress
318,420
$82,140
41.2%
+5.8%
Nashville
The Gulch
224,860
$74,390
44.7%
+6.2%
Phoenix
Midtown
412,190
$61,820
38.9%
+4.1%
Charlotte
South End
287,640
$79,550
35.6%
+5.3%
2. Revenue Trajectories — CMBS Competitive Set
Figure 1 plots annual Effective Gross Income from 2019 forward for every CMBS-reporting facility within 5 miles of any anchor. Revenue trajectories follow the now-familiar post-COVID arc: strong ramp from 2020 through mid-2022, followed by a plateau or modest decline. The top performer is StoreSmart Nashville ($3.4M EGI, recently stabilized), while Phoenix comps show the most pronounced correction off 2022 peaks.
Annual EGI by Facility — CMBS Competitors ($M) · 2019–2024
Nashville
Austin
Phoenix
Charlotte
TractIQ · Meridian Capital Brief
3. NOI Margin Performance by Market
Margin compression is most severe in Phoenix, where CMBS comps averaged 70.2% peak NOI margin (mostly peaking in 2022) and 63.4% latest — a 6.8pp compression as operating costs outpaced revenue growth. Austin and Nashville show far more resilient margins, down only 1-2pp from peak. Charlotte's independent operators continue to outperform institutional comps on margin, likely reflecting lower management fees.
NOI Margin — Peak vs. Latest by Market
Austin (peak)
76.1%
Austin (latest)
74.2%
Nashville (peak)
78.4%
Nashville (latest)
76.9%
Phoenix (peak)
70.2%
Phoenix (latest)
63.4%
Charlotte (peak)
73.1%
Charlotte (latest)
71.6%
4. Operator Composition & Pipeline
Austin and Nashville are REIT-dominated (78% and 71% respectively), providing pricing discipline but limiting acquisition opportunities. Phoenix has the most diverse operator mix with 18 sophisticated private operators alongside 22 REITs. Charlotte's 52/48 institutional-independent split creates potential off-market deal flow. Pipeline risk is concentrated in Phoenix (4 projects, 318k NRSF under construction) and minimal in Nashville (0 permitted projects within 3 miles).
Market
REITs
Soph. Private
Independent
Pipeline NRSF
Pipeline Risk
Austin
14
3
1
84,000
Moderate
Nashville
12
4
1
0
Low
Phoenix
22
18
7
318,000
High
Charlotte
9
2
8
62,000
Moderate
TractIQ · Meridian Capital Brief
Appendix A. CMBS-Reporting Competitors
Every competitor in the anchor trade areas with full CMBS financials, including years reported, latest EGI, EGI/NRSF, multi-year CAGR, and NOI margin change from peak.
Facility
Market
NRSF
Latest EGI
CAGR
Margin
Δ Peak
StoreSmart Nashville
Nashville
68,200
$3,412,850
9.4%
76.9%
0.0pp
Extra Space — S. Congress
Austin
94,500
$2,847,320
7.8%
74.2%
−1.9pp
CubeSmart — Midtown PHX
Phoenix
112,400
$2,614,180
6.2%
63.4%
−6.8pp
Public Storage — South End
Charlotte
76,800
$2,391,640
8.1%
71.6%
−1.5pp
Life Storage — Nashville
Nashville
52,100
$1,988,450
11.2%
77.3%
0.0pp
iStorage — Phoenix W
Phoenix
88,300
$1,742,920
3.4%
58.1%
−9.2pp
SecurCare — Charlotte NC
Charlotte
44,600
$1,624,810
6.9%
69.8%
−2.1pp
5. Next Steps
This brief positions Meridian to size four opportunities with distinct risk profiles. Nashville's zero-pipeline environment and strong margin resilience make it the most defensible near-term entry. Austin's supply-constrained fundamentals support a long-term thesis despite current rate correction. Phoenix requires conservative year-one underwriting given pipeline exposure. Charlotte's fragmented operator landscape creates off-market deal flow potential. TractIQ can deliver: (i) parcel-level deep-dive on any anchor, including occupancy seasonality and full P&L lines; (ii) refined competitive analysis filtered to Meridian's target product spec; (iii) updated pricing pulls at any cadence required.
Before, your underwriting models ran on assumptions. The TractIQ AI Connector replaces those assumptions with verified data.
before
Log into TractIQ, run a search, wait for results
Export a report, open Excel, paste the data manually
Reformat for your model, update PowerPoint slides by hand
Repeat this for every market, every deal, every meeting
Hours lost per week on data logistics, not analysis
after
Ask Claude or ChatGPT a question in plain English
Live TractIQ data is fetched and returned instantly
Pull facility comps, occupancy, and rates directly into Excel
Create PowerPoint decks with real market data in one step
Spend your time on the analysis — not the data wrangling
Industry Leaders WhoTrust TractIQ
"AI is only as good as the data underneath it. TractIQ understood that from day one. They built the data layer right first, then earned the right to put AI on top. At MyPlace, we run TractIQ on every deal we underwrite and across our entire portfolio. The data holds up under institutional scrutiny, the kind that matters when an answer has to stand up in front of an investment committee, not just sound right in a chat window."
"TractIQ's AI Connector is one of the most important pieces of our underwriting upgrades. Initial underwriting now runs through Claude, with TractIQ auto-populating comps, driving the demographic inputs behind our key assumptions, and flagging supply markers. From my phone, I can pull detailed market insights that feed directly into quarterly narratives and IC memos. It is integral to how we deploy AI across our work."
"Competitive occupancy has always been one of the hardest metrics to track with confidence. TractIQ gives us real, reported occupancy at the facility level. When you layer in in place financials and achieved rents, it materially changes underwriting and helps us make smarter revenue and pricing decisions with far more certainty. For us, it is a game changer."
“You’re cooking with grease here. Having occupancy plus full financials in the exact markets we buy in is pretty incredible. This is exactly the kind of data we want in underwriting.”
“Occupancy has been one of the biggest pain points in our underwriting process. TractIQ replaces guessing with real market context and makes it much easier to build conviction and communicate it clearly to investment committee. You make it easy to be a strong advocate.”
“TractIQ has become a core part of how we explain the market to LPs and lenders. We use the REIT reporting and historical rate trends constantly because it helps us put today’s rents into real context. When you layer in true facility level occupancy and comp level financials, it’s a 10 out of 10. It democratizes the data, makes everyone smarter, and keeps people from making expensive mistakes.”
“Before TractIQ, occupancy was mostly anecdotal. We were stitching together assumptions. Having real historic occupancy and financial data allows us to tell a credible market story and dramatically improves the quality of our offering materials.”
“This is the first truly differentiating upgrade we’ve seen in self-storage software. Reliable occupancy plus comp level financials and deep rate history gives you a full snapshot of a market in one place. It can pay for itself with one deal and fundamentally changes how serious investors and brokers underwrite deals.”
“Seeing real, facility level occupancy alongside long term rate history is unbelievable. This is a 10 out of 10 and a true game changer for the industry. For the first time, you can understand how markets actually perform over time instead of relying on assumptions. It completely changes how confidently deals are priced, underwritten, and evaluated.”
“This is what everyone is looking for. Even having one or two truly comparable facilities with occupancy and full financials in a tight radius helps us underwrite the entire deal, from revenue to utilities and expenses. It takes a huge amount of guesswork out of the process.”
"TractIQ has been a game changer for our firm. We recently had a deal approved because we could quickly and confidently support data in a key market — all thanks to TractIQ. The platform is intuitive, the team is responsive, and it has reduced our research time dramatically. I’d highly recommend TractIQ to any investor looking for a smarter, faster, more insightful way to work."
"TractIQ has transformed how our acquisitions team works. It streamlines the process of identifying deals that align perfectly with our clients’ buy boxes, and the dynamic, accurate data saves us countless hours — time we now spend on strategy and closing. The visually compelling reports are powerful value-adds for both our team and our clients. TractIQ has truly elevated our efforts, empowering us to move faster, work smarter, and deliver greater value. It’s not just a tool — it helps us make data-driven decisions and stand out from the competition."
“TractIQ is a game changer. It brings everything investors and operators need into one system, making data-driven decisions faster and easier than ever.”
“TractIQ takes what used to be 20 hours of research and delivers it in two minutes. I cannot speak more highly about what TractIQ is doing. The software gives you as much data, as concisely as possible, to help you make big decisions with confidence. If I’m going to get to no, I want to get to no in two minutes, not 20 hours. That’s the beauty of TractIQ—it helps me understand a market quickly and clearly when I’m making $10–20 million decisions.”
“This is great. This is wonderful. This is fantastic. The
software’s amazing because beyond rental stuff,
there’s filtering. You could spend days in here just
having fun⎯looking at different things. There's so much
data. It’s insane. I’ve never seen anything like it.”
"TractIQ pulls together the best of all platforms and filters out the garbage in a way that provides a self-storage investor exactly the information they need."
“TractIQ is extremely unique in terms of numerous exportable market reports, housing development data, commercial development data, traffic count information, flood zone maps, and so much more.”
“TractIQ gives me everything I need in one place. The interface is incredibly clean and user-friendly, the pricing is unbeatable, and I can pull full reports in seconds. I’ve saved millions of dollars by using TractIQ. It’s completely changed the way I evaluate markets and present deals. I recommend it to brokers, developers, operators, and even lenders. The data is real and reliable.”
The data that closes deals. Inside every tool you trust.