Revealing the Gap Between Street and Web Rates
TractIQ is breaking down six years of self-storage discounting data in a 10-part series. Below, are parts 6-10. Scroll to the bottom to download all 10 parts of the report.

You’ll see that advertised rates can change as much as 30% or more within a year’s time because operators are constantly adjusting pricing strategies to reflect the demand in the market. With a high student population in Austin, there’s a predictable summer surge in demand that operators respond to in real-time.
Due to the fast-paced nature of self-storage operations, advertised rental rates and in-place rental rates vary widely at the facility level, let alone within a submarket. Advertised rates can tell us a lot about self-storage demand.
Before diving into the insights these rates can provide, let’s define some key terms that are foundational to understanding self-storage pricing dynamics:
Web Rates: The rates advertised online, often discounted to attract price-sensitive shoppers. These typically include short-term promotional pricing.
Street Rates: The street rate for a particular unit is the rate that a customer would be charged if they were to walk in off the “street” and rent a unit in person at the facility. Given that customers are less likely to price-shop in this scenario, the street rate is typically higher than the web rate.
In-place Rates: The actual rates paid by existing tenants, which can exceed both web and street rates due to regular existing customer rent increases (ECRIs) after the initial promotional period.
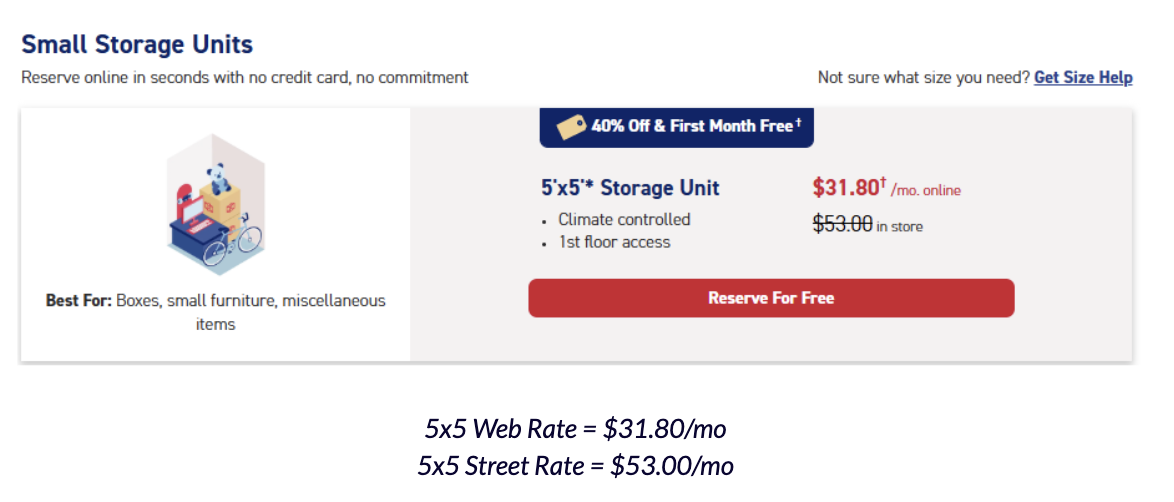
See an example below from a CubeSmart facility. TractIQ tracks both the advertised web rates as well as the crossed-out advertised street rate to help investors inform their assumptions.
Now that we have a foundational understanding of web, street, and in-place rates, we can further explore what these rates and their relationship tell us about self-storage demand.
PART 6: Extra Space’s Discounting Strategy Reveals a Larger Focus On Occupancy Compared to Other REITs

As shown in the graph above with the green arrows, the difference between Extra Space’s street rates and web rates (yellow line) at the end of 2024 is nearly the same level as it was in 2021, when demand for self-storage was the highest.
Why is the difference in rates for 2021 and 2024 similar when demand was vastly different?
You will notice that the actual rates in 2024 compared to those in 2021 are also vastly different. The table below shows Extra Space street and web rates in 2021 compared to those in 2024. Interestingly, Extra Space is currently dropping both street rates and web rates to capture any demand within a challenging market.
| Extra Space | 2021 | 2024 | % Discount |
| Street Rate | ~$2.20 | ~$1.25 | 43% |
| Web Rate | ~$1.80 | ~$1.00 | 44% |
In recent earnings calls, Extra Space expressed that they are hyper-focused on maintaining high occupancy. This strategy is confirmed by the data above and shows that Extra Space is willing to decrease their initial move-in revenue to prop up occupancy. Extra Space wants customers in the door, even if it would mean dropping street and web rates to very low levels.
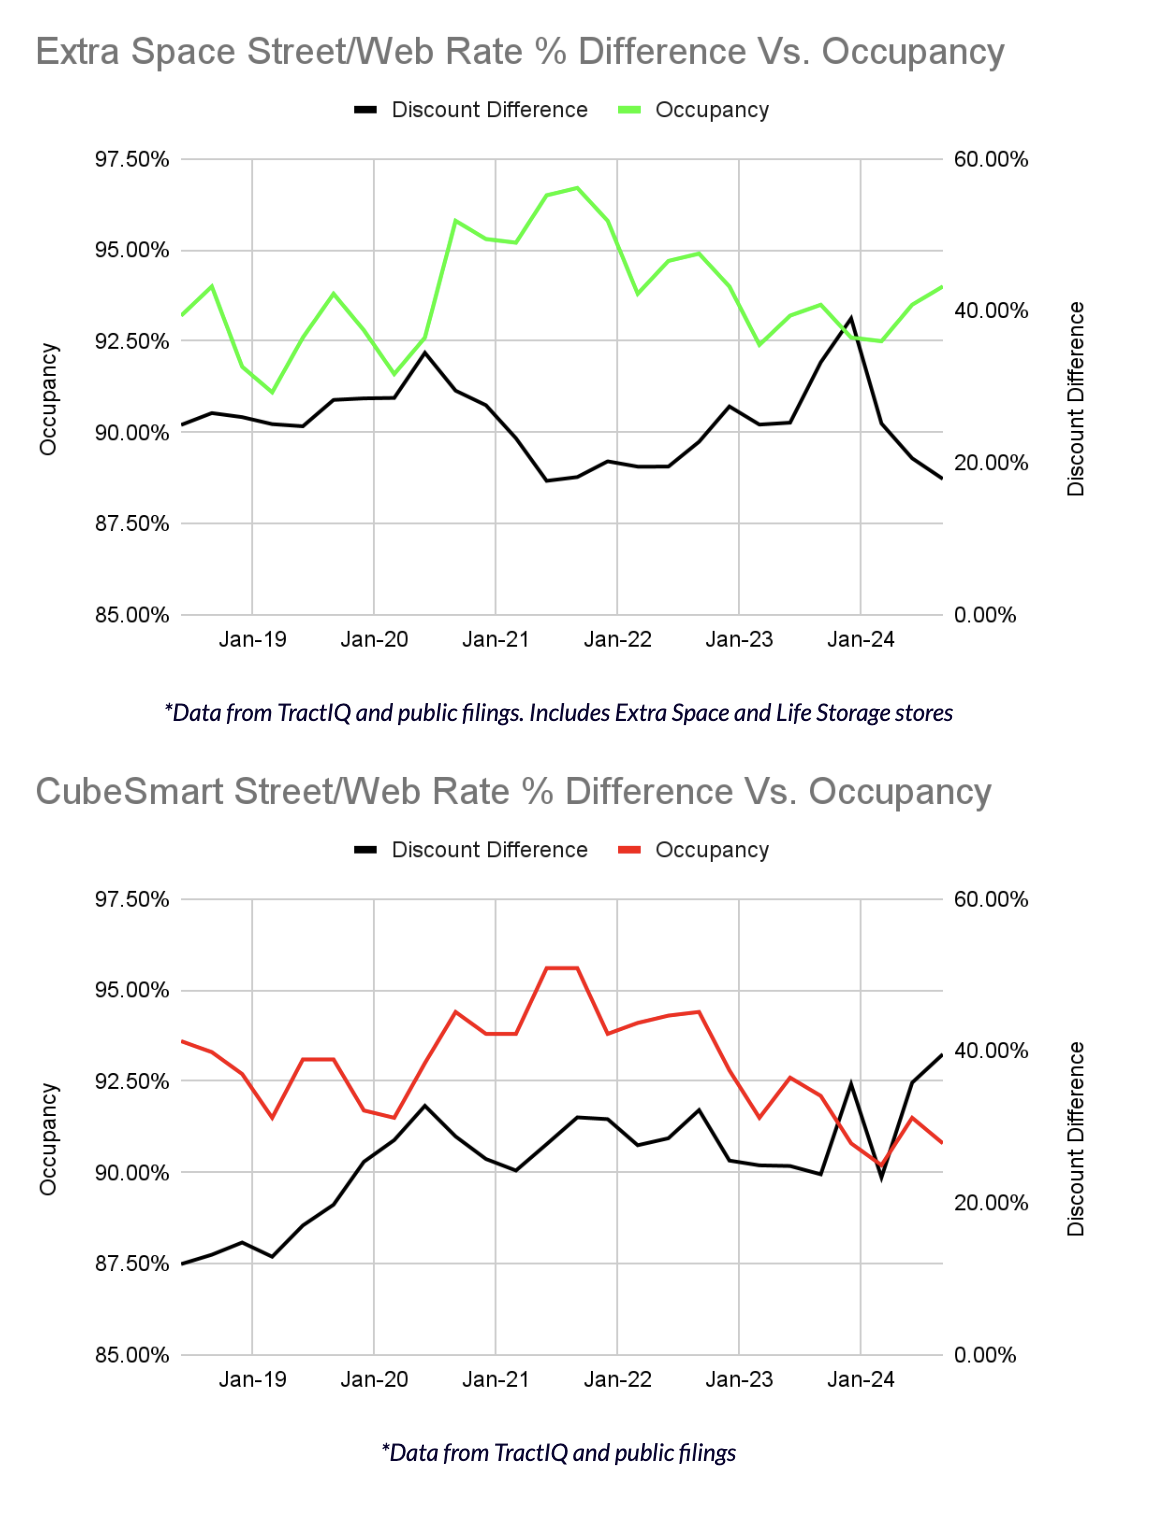
PART 7: CubeSmart’s Discounting Strategy Reveals a Balance Between Revenue and Occupancy Compared to Other REITs
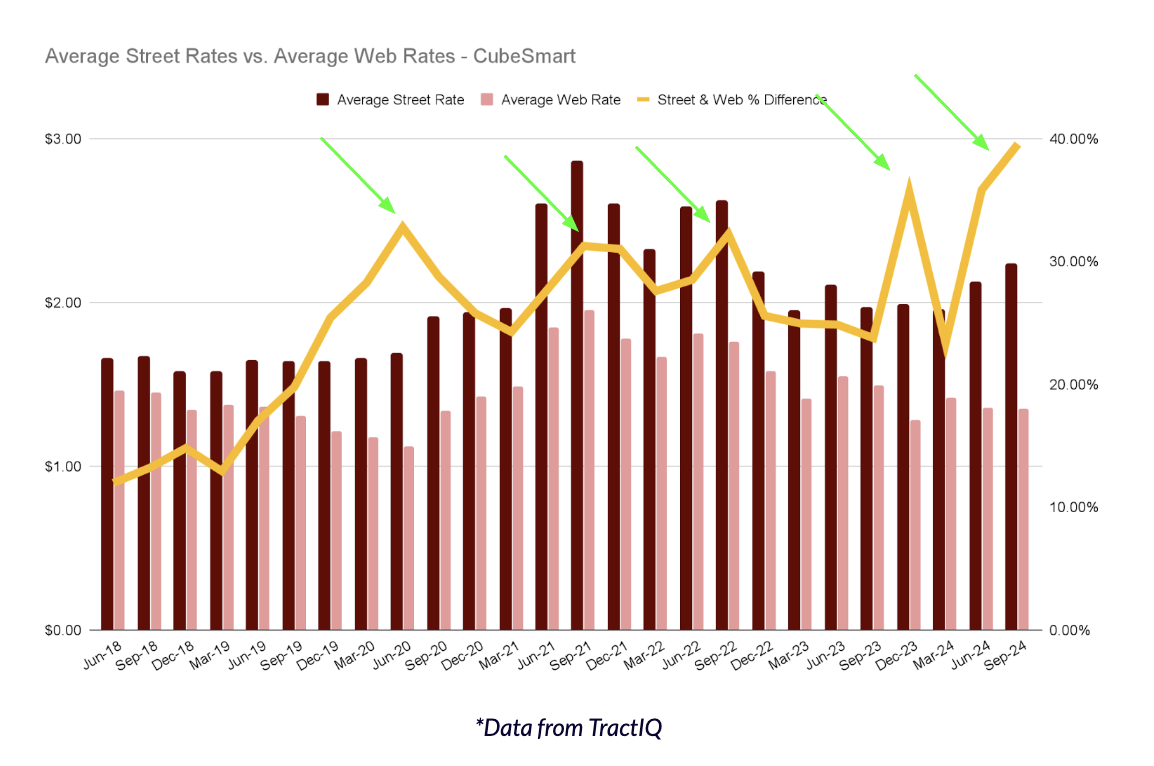
As shown in the graph above, CubeSmart has maintained remarkably high discounts in recent history. The difference between street and web rates has crested over 30% five times in the last 5 years compared to Extra Space, where it has happened only twice, and Public Storage, where it has happened only once.
Interestingly, CubeSmart has held street rates and web rates relatively steady in recent history. Compared to Extra Space and Public Storage, CubeSmart appears to be the most consistent in their pricing strategy.
Recently, however, CubeSmart’s web rates have slightly decreased, while street rates have increased, creating a wide spread of nearly 40% between the two. Perhaps this is CubeSmart’s way of trying to maintain higher revenue from move-ins while also trying to attract new customers online during a time of low self-storage demand.
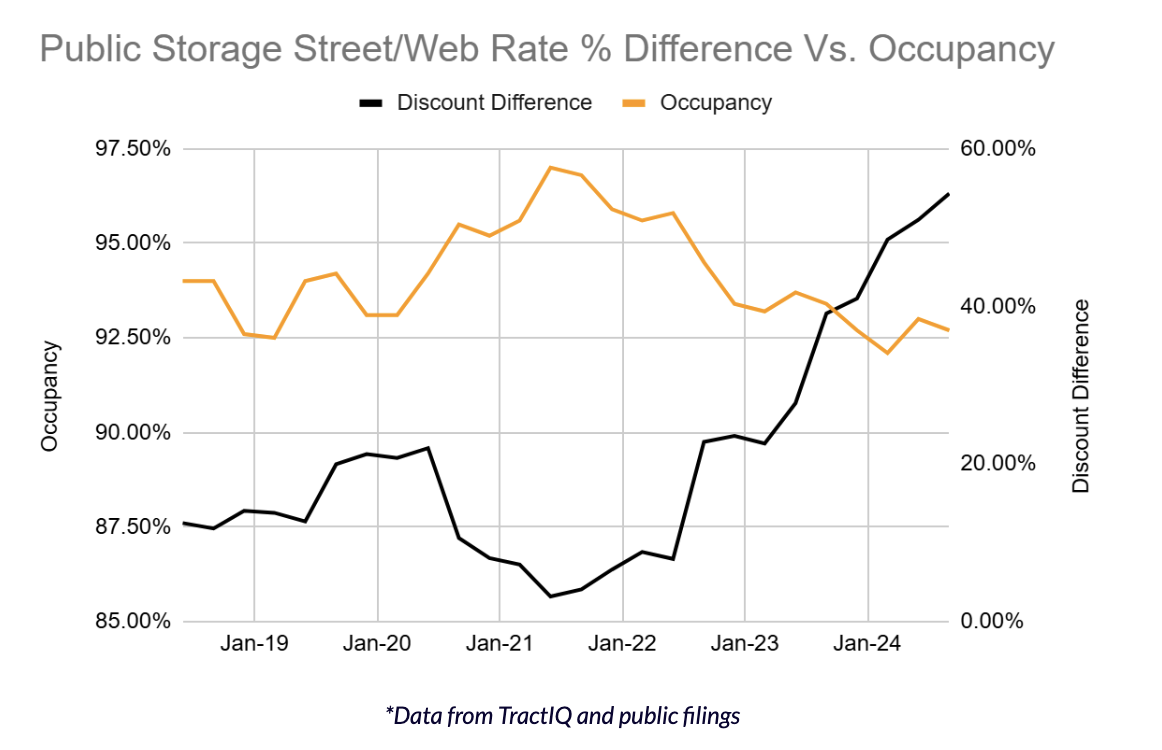
PART 8: Public Storage’s Discounting Increased 10x Since June 2021
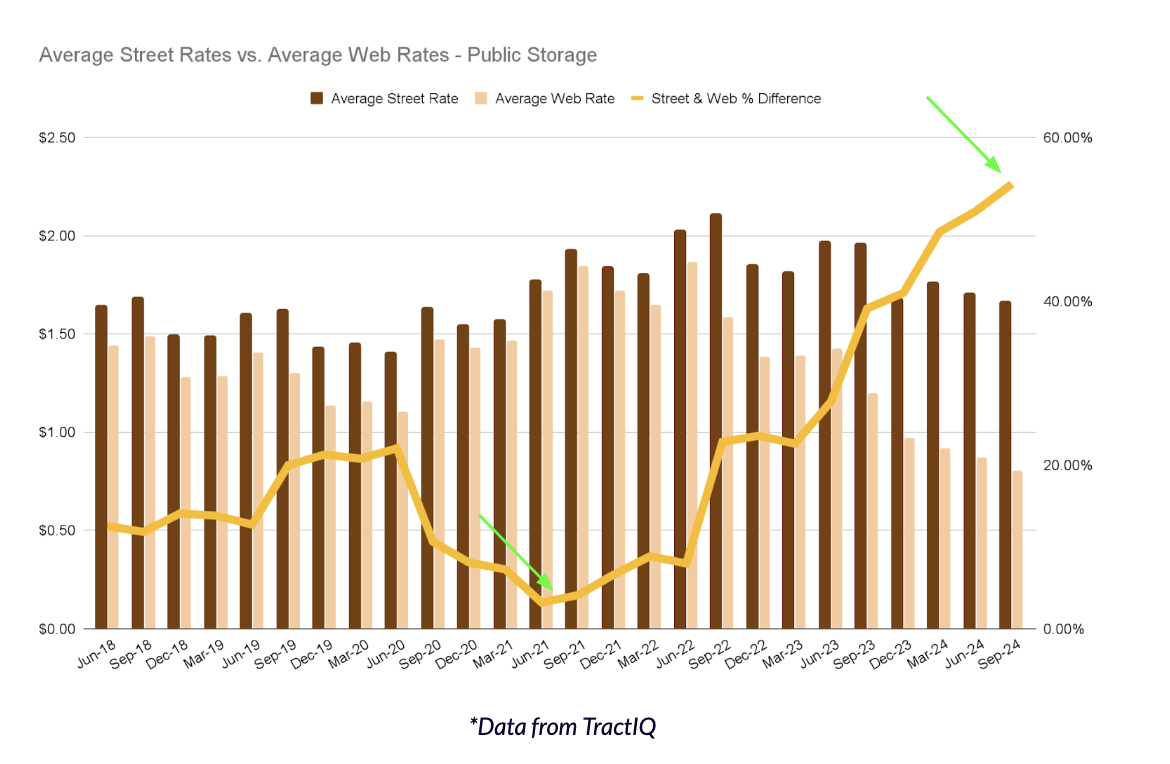
Public Storage has been the most aggressive in discounting their web rates to street rates over the last year. As of Q3 2024, the street/web rate difference is ~55%, the highest out of all the REITs currently and in recent history.
This is in contrast to the summer of 2021 when Public’s street rates and web rates were nearly identical and self-storage demand was at its peak.
Public Storage has held street rates mostly steady over the last year, but their web rates have decreased significantly and are ~$0.75 as of the end of 2024. This is far below Extra Space and CubeSmart, whose web rates are above $1.00 as of the end of 2024. This data suggests that Public Storage is determined to win the pricing battle for new online customers.
PART 9: How the REITs Compare to Each Other
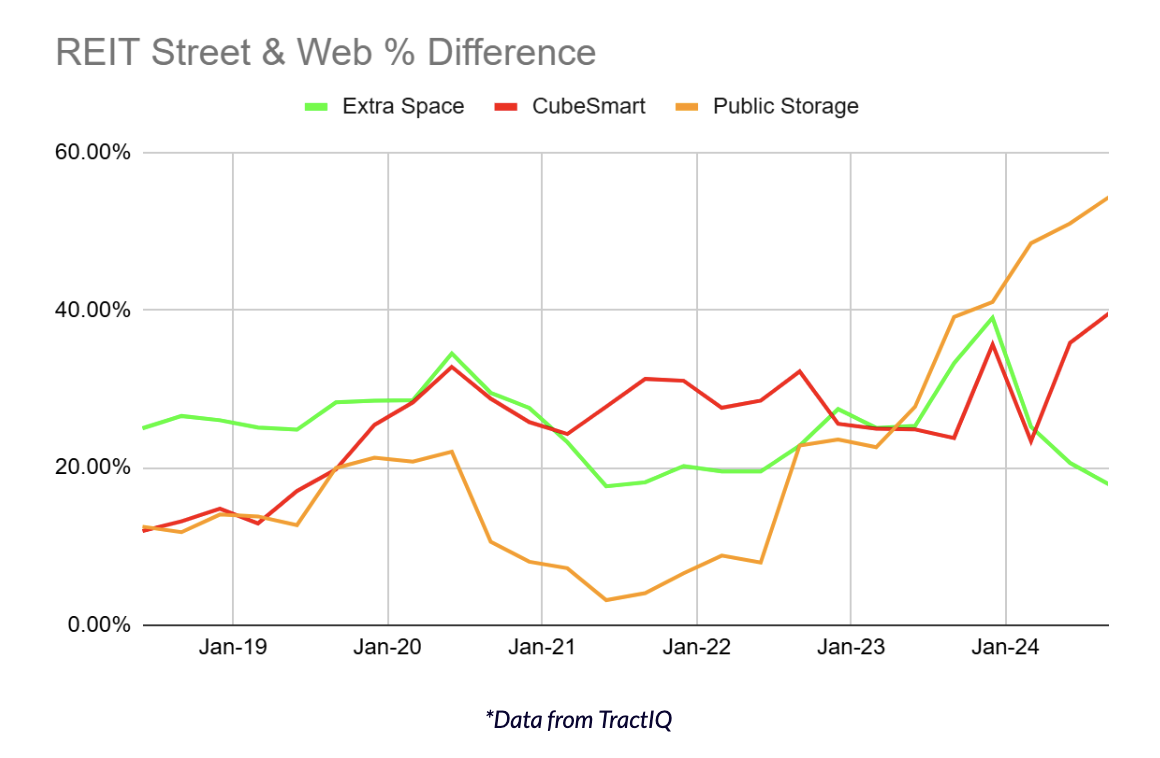
To summarize the REITs, the above graph takes the yellow discounting line in each of the previous three REIT graphs and compares them. Even though Extra Space, CubeSmart, and Public Storage operate in the same business, it is interesting to see how their pricing strategies differ in recent history and where they are today. Based on the data in the previous three sections, each REIT’s strategy can be summarized below.
- Extra Space is heavily focused on maintaining high occupancy and is willing to sacrifice initial move-in revenue to achieve this. They are currently dropping both street and web rates to prop up occupancy.
- CubeSmart is performing a balancing act of capturing higher move-in revenue by increasing street rates and attracting new online customers by decreasing web rates.
- Public Storage has not changed street rates too drastically recently to keep move-in revenue steady, but they are determined to win the pricing battle for new online customers by decreasing web rates drastically.
PART 10: Discounting Strategies for Non-REIT Operators
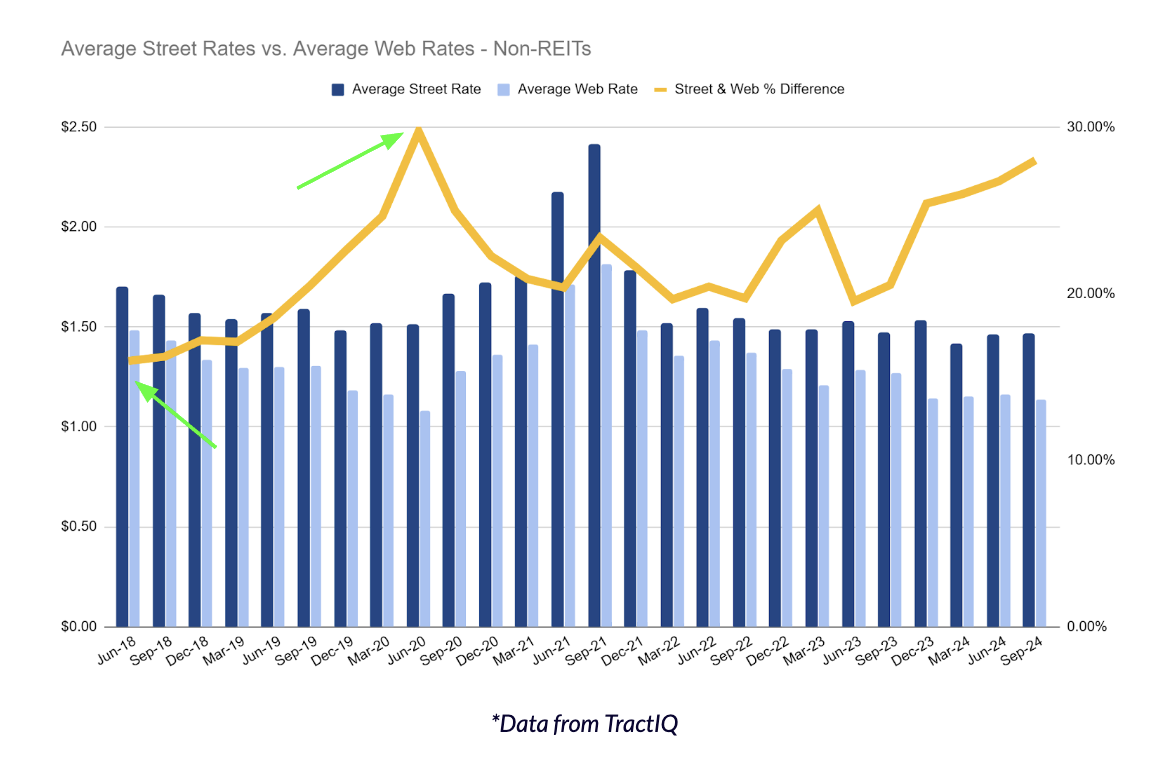
The analysis above shows street rates, web rates, and the average difference of those rates for only non-REIT operators. As shown by the green arrows above, the minimum value of the street/web rate % difference is ~18% while the maximum value is ~30% (1200 bps) – less than half of the REIT spread (2700 bps).
Most non-REIT operators do not have the algorithms and revenue management teams that the REITs do, so they do not change prices as often nor as aggressively. In addition, non-REIT operators tend to have facilities located in more suburban or rural areas as opposed to REIT operators. Operators with facilities in rural areas may be less likely to implement aggressive price changes because it would be more challenging to replace a customer if they leave.
Facilities located in denser areas can replace customers more easily because they have a greater population to draw from. This provides the operator more leeway to experiment with frequency and magnitude of price changes.
Despite all of this, non-REIT operators do respond over time, with a steadily increasing discount rate from ~18% to ~30% leading up to COVID and a similar run up during the post-COVID market weakness.
How Discounting Correlates to Occupancy
It is no secret that the self-storage industry has faced significant headwinds since 2023. Inflation and rising interest rates have put pressure on the consumer and dampened residential migration, decreasing self-storage demand. These pressures have significantly decreased transaction and investment activity within the self-storage industry.
How do self-storage operators respond when demand dries up and the future is uncertain? They aggressively discount rental rates to attract whatever customers remain.
REITs are more willing to experiment with rates and discounting to attract more customers. Each REIT seems to be focused on different strategies that have changed and evolved over time. So which strategy is winning?
Unfortunately, a “winning” strategy has not emerged.
According to TractIQ’s Q3 2024 Storage REIT Report, every REIT has experienced a decrease in revenue and NOI growth over the last year, and their stocks are down ~5.6% on average year-over-year. When there is simply a lack of demand in the market for self-storage, revenue and NOI growth will be negatively affected, no matter how heavily rates are discounted.
The three graphs below show the discounting difference for each REIT compared to occupancy over time.
In the graphs, occupancy is used as an indicator of storage demand. However, occupancy is only one factor out of many that can indicate storage demand within a market. You will notice an inverse relationship between the discounting difference and occupancy. As discounting increases, occupancy (demand) decreases, and vice versa.
If we take a step back, what story does all of this data tell us?
- A wide spread between street and web rates typically signals less self-storage demand in the market because operators are competing more for customers by discounting web rates
- A tight spread between street and web rates typically signals more self-storage demand in the market because operators don’t need to discount web rates as much when more customers are renting storage
- REITs are major drivers for rate discounting trends with non-REIT operators typically following the same trends in less aggressive ways
Demand for self-storage will always fluctuate based on a variety of factors. Paying attention to street and web rates provides valuable insights as we all look to make smarter, data-driven investment decisions in 2025 and beyond.