
The market-level rate and occupancy data behind our Q1 2026 Self-Storage REIT Report — realized rent per occupied square foot, year-over-year movement, and physical occupancy, broken out MSA by MSA across the five public storage REITs.
At the national level, Q1 2026 REIT rents moved within about two points of flat — easy to read as a quiet market. Underneath that average, a single operator’s best and worst markets ran 11 to 19 points apart. A national number simply can’t price a deal in a specific trade area.
Q1 2026 rents moved within ~2 points of flat for every REIT — read that as “quiet” and you'll misprice.
Within a single operator’s footprint, the gap between its best and worst market ran 11 to 19 percentage points of rent growth this quarter.
Two operators in the same MSA ran 10 points apart — the market average alone can't underwrite a deal.
National REIT rents looked roughly flat in Q1 2026 — but the source rate data tells a sharper story. Below: REIT street rates against achieved rent (a ~25% spread), and same-store occupancy versus the broader market. The full data set adds rent per occupied square foot, MSA by MSA.
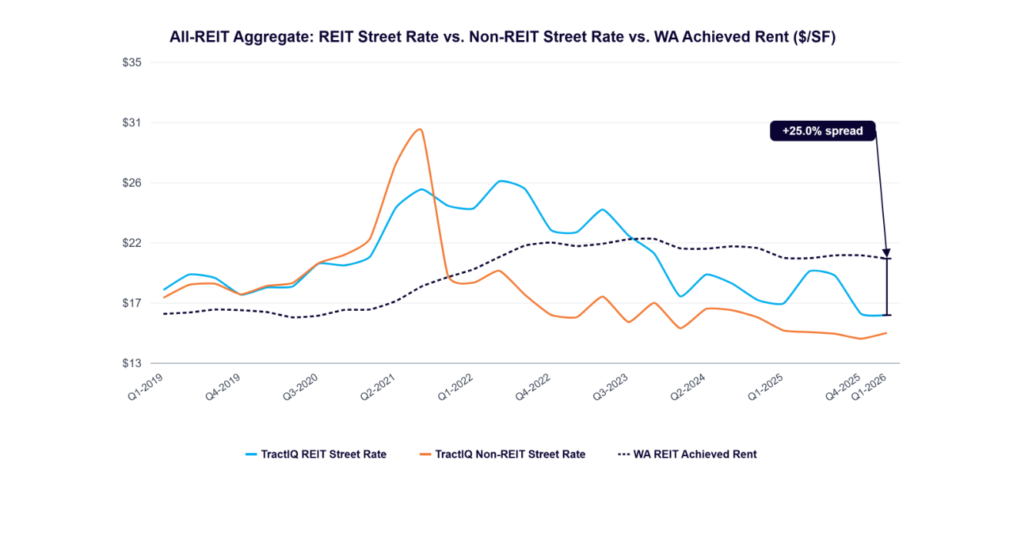
TractIQ-tracked REIT street rates vs. non-REIT street rates and weighted-average achieved rent — a ~25% spread. (Q1 2026)
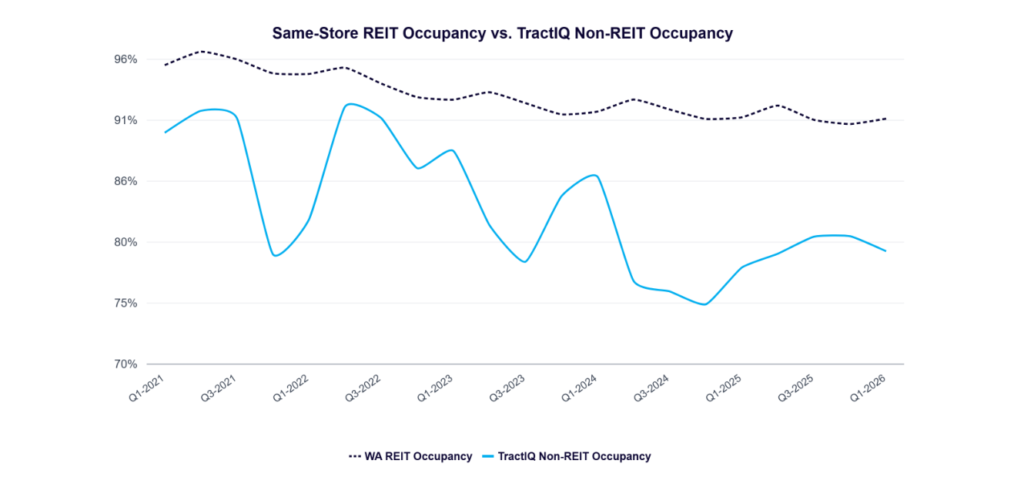
Same-store REIT occupancy holds above the broader non-REIT universe. (Q1 2026)
Market-level rent for the five public storage REITs, broken out metro by metro across roughly 5,800 facilities.
See how rents and physical occupancy moved this quarter — and which direction each market is heading.
Download clean, structured market data from the REITs
Public Storage, Extra Space, CubeSmart, NSA, and SmartStop — refreshed every quarter.
Drop your email in the form — no sales call, no credit card.
Get verified REIT rent, occupancy, and year-over-year movement, compiled MSA by MSA and ready to use.
Export straight to your computer to help inform underwriting assumptions.
Companion data · Q1 2026























This quarter we’re opening up the market-level rate and occupancy data behind our Q1 2026 Self-Storage REIT Report, pulled across the five publicly traded operators: Public Storage, Extra Space, CubeSmart, National Storage Affiliates (NSA), and SmartStop. Together the data set spans roughly 5,800 facilities and more than 420 million rentable square feet, broken out MSA by MSA with realized rent per occupied square foot, year-over-year rent movement, and physical occupancy trends.
At the national level, achieved rent per occupied square foot moved within about two percentage points of flat for every REIT in the group, from roughly -2.1% at Public Storage to +1.3% at SmartStop, and portfolio-wide occupancy shifted by less than a point in either direction for all five. If you stopped there, you’d conclude the storage market simply isn’t doing much. That conclusion would be wrong almost everywhere.
Underneath those flat national numbers sits enormous local variation. Within a single operator’s footprint, the gap between its best and worst market ran 11 to 19 percentage points of rent growth this quarter.
| REIT | National rent/occ sq ft YoY | Strongest market | Weakest market | Spread |
|---|---|---|---|---|
| Public Storage | -2.1% | Minneapolis +4.8% | Austin -6.2% | 11 pp |
| Extra Space | +0.9% | Richmond +8.2% | San Antonio -11.1% | 19 pp |
| CubeSmart | -0.4% | Hartford +5.1% | Dallas–Ft. Worth -10.5% | 16 pp |
| NSA | +1.1% | San Juan, PR +4.3% | San Antonio -7.3% | 12 pp |
| SmartStop | +1.3% | Chicago +6.2% | Port St. Lucie -4.3% | 11 pp |
Across all disclosed markets, the split was nearly even: about 53% posted rising rents and 47% posted falling rents. Realized rents ranged from under $11 per square foot in tertiary markets like Oklahoma City, Shreveport, and Amarillo to nearly $56 per square foot in Honolulu, a five-fold spread that makes any single national average rent effectively meaningless for an underwriting model.
The strength clustered in the Midwest and the Northeast/Mid-Atlantic, older, supply-constrained, slower-growth metros. St. Louis (+7.6%), Richmond (+8.2%), Indianapolis (+4.2%), Minneapolis (+4.8%), Boston (+4.3%), Washington, D.C. (+3% to +4.5%), and Chicago (+3% to +6.2% across all four operators present there) led the pack.
The weakness was just as concentrated, and it was overwhelmingly a Sun Belt story. Texas was the epicenter: San Antonio fell 5.8% to 11.1% depending on the operator, Austin slid as much as 7.3%, and Dallas–Fort Worth ranged from roughly flat to down 10.5%. Florida cooled on the occupancy side, with Tampa losing 2 to 4 points of occupancy across every REIT and coastal markets like Cape Coral–Fort Myers and Port St. Lucie giving back both rent and occupancy. These are precisely the markets that absorbed the heaviest new development in 2021–2023, and the oversupply hangover is now showing up in the rate data.
The most important point for anyone underwriting an acquisition is that even the MSA average can mislead. In Dallas–Fort Worth this quarter, Extra Space was essentially flat at -0.3% while CubeSmart was down 10.5%, a ten-point gap inside the same metro, driven by submarket mix, asset vintage, lease-up exposure, and revenue-management strategy. In Phoenix, physical occupancy ranged from 78.9% at one operator to 95.1% at another. And rent and occupancy frequently moved in opposite directions: several operators pushed rate while shedding occupancy, and others traded rate to defend occupancy, different bets on the same fundamentals.
The lesson is the one we keep coming back to: storage is a local business, and it underwrites locally. A pro forma built on “national rents were roughly flat” would have been dangerously optimistic in parts of Texas and far too conservative in the Midwest. National REIT averages are useful for observing general trends, but they are the wrong instrument for valuing a specific asset in a specific trade area. The data that matters lives at the market and submarket level, exactly what our self-storage market data, occupancy data, and underwriting guide are built to surface. When you’re ready to pressure-test a specific deal, you can book a demo or compare pricing.
Data source: TractIQ Q1 2026 Self-Storage REIT Report. Figures reflect operator-disclosed MSA-level rent per occupied square foot and physical occupancy.
